
Vea también


 24.07.2026 07:51 AM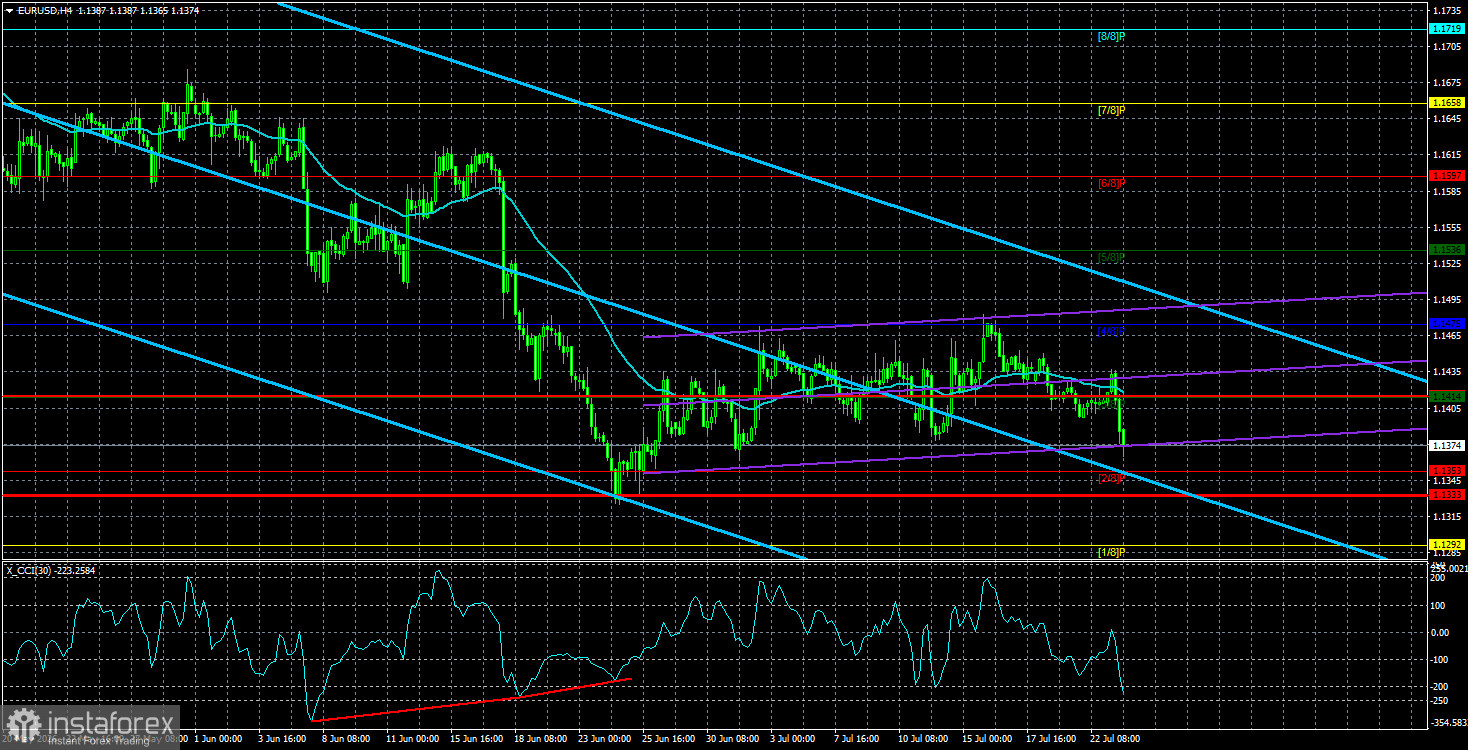
The EUR/USD currency pair showed some interesting movement on Thursday. Immediately after the announcement of the European Central Bank meeting results (which, by the way, didn't surprise traders at all), the euro lost about 60-70 pips. This means that the market's reaction to the important event was again quite weak. Moreover, the price remained within the sideways channel of 1.1362-1.1461 (which is clearly visible on the hourly timeframe) and continued to stay within it. Thus, the flat trend persists, and the market's reaction in the form of selling the euro again seems completely illogical.
The last few weeks have shown and proven only one thing – the market, under no circumstances, wants to buy the euro. For more than three weeks, the euro has been inching upwards, managing to appreciate by 140 pips in that time. Ridiculous. A month and a half ago, the ECB was the first among major central banks to tighten monetary policy in response to rising inflation due to the conflict in the Middle East—the first and, at this moment, the only one. While the Federal Reserve observes and ponders, the ECB is tightening away, which has no bearing on traders.
Yesterday, Christine Lagarde announced that the central bank will take a pause in July to assess how much inflation might rise after the resumption of the conflict in the Middle East and the increase in oil prices to $100 per barrel (which is unlikely to be the upper limit for "black gold"). The ECB also reported that the full effect of the energy shock has not yet manifested and that the duration of this shock could be quite long. In other words, the ECB does not want to rush into tightening, but is ready for a new hawkish step as soon as it confirms that inflation is accelerating again.
Thus, in September, the ECB may implement a second rate increase. As for expectations and reality regarding the July meeting, no analysts or traders expected any hawkish moves from the ECB. In other words, expectations matched reality, and hawkish hints for September were supposed to support the euro rather than provoke its fall. In any case, even if the ECB does not raise rates at the next meeting, there were no grounds for the euro's drop yesterday. However, the market and market makers trade as they see fit. Sometimes their actions align with logic and common sense, and sometimes they don't. In recent weeks, we have consistently stated that the technical picture looks like a preparation for a new drop, despite the ongoing global uptrend. And that is exactly what happened, despite the relatively hawkish results of the ECB meeting.
It is also worth noting that the fall of the EUR/USD pair could end at any moment, as there are still no global factors for the rise of the US dollar and the fall of the euro. The lower the euro drops now, the stronger it will rise later, and market movements are not always logical. This should always be kept in mind.
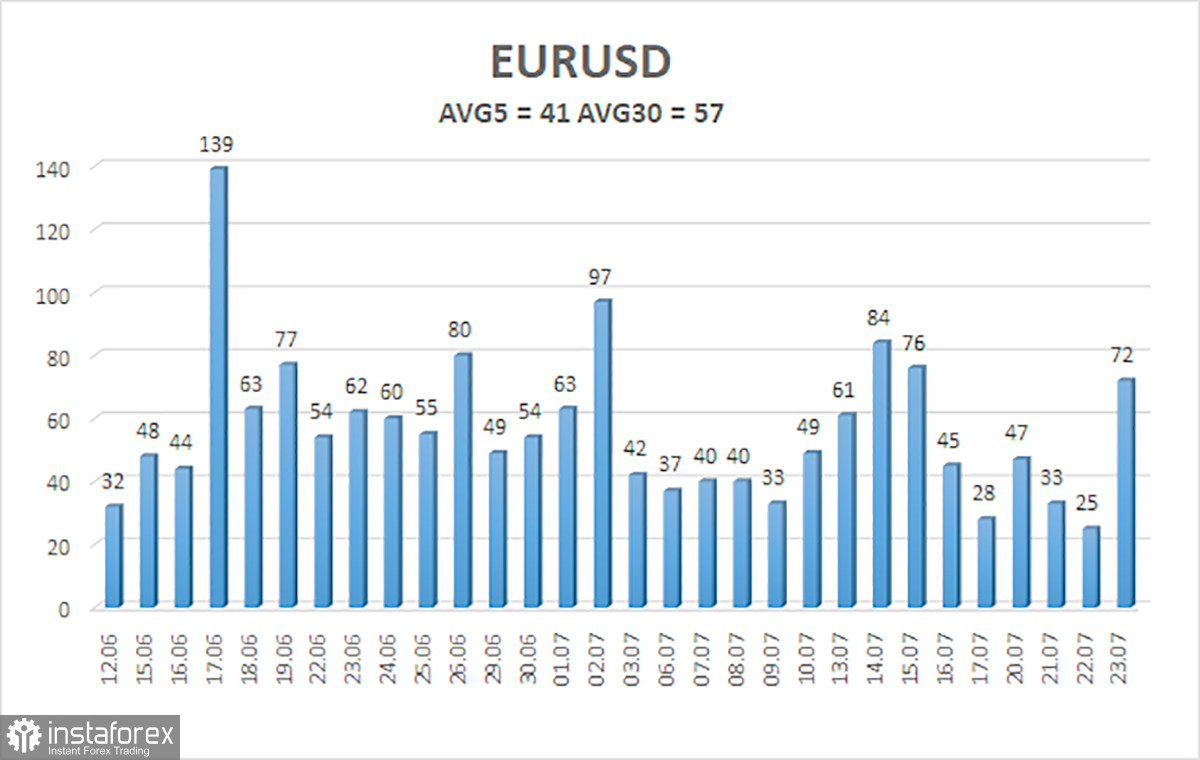
The average volatility of the EUR/USD currency pair over the last 5 trading days as of July 24 is 41 pips and is characterized as "low." We expect the pair to move between levels 1.1333 and 1.1415 on Friday. The upper channel of linear regression is directed downwards, indicating a continued downward trend. The CCI indicator has entered the oversold area and formed two bullish divergences, which warn of a possible end to the downward trend.
S1 – 1.1353
S2 – 1.1292
S3 – 1.1230
R1 – 1.1414
R2 – 1.1475
R3 – 1.1536
The EUR/USD pair maintains a downward trend, which is presumably a correction within the framework of the global uptrend, as can be clearly seen on the daily or weekly timeframe. The global fundamental outlook for the dollar remains negative, but in 2026, first geopolitics and then the hawkish sentiment of the Fed provided strong support for the US currency. With the price positioned below the moving average, short positions can be considered with targets of 1.1353 and 1.1333. Above the moving average line, long positions with targets of 1.1475 and 1.1536 are relevant. The market has been in a flat for the fourth consecutive week.
Linear regression channels help determine the current trend. If both are pointing in the same direction, the trend is currently strong;
The moving average line (settings 20,0, smoothed) defines the short-term trend and the direction in which trading should currently be conducted;
Murray levels are target levels for movements and corrections;
Volatility levels (red lines) indicate the probable price channel within which the pair will operate in the next 24 hours based on current volatility indicators;
The CCI indicator – its entry into the oversold area (below -250) or the overbought area (above +250) means that a trend reversal in the opposite direction is imminent.


