See also

 20.02.2026 06:49 AM
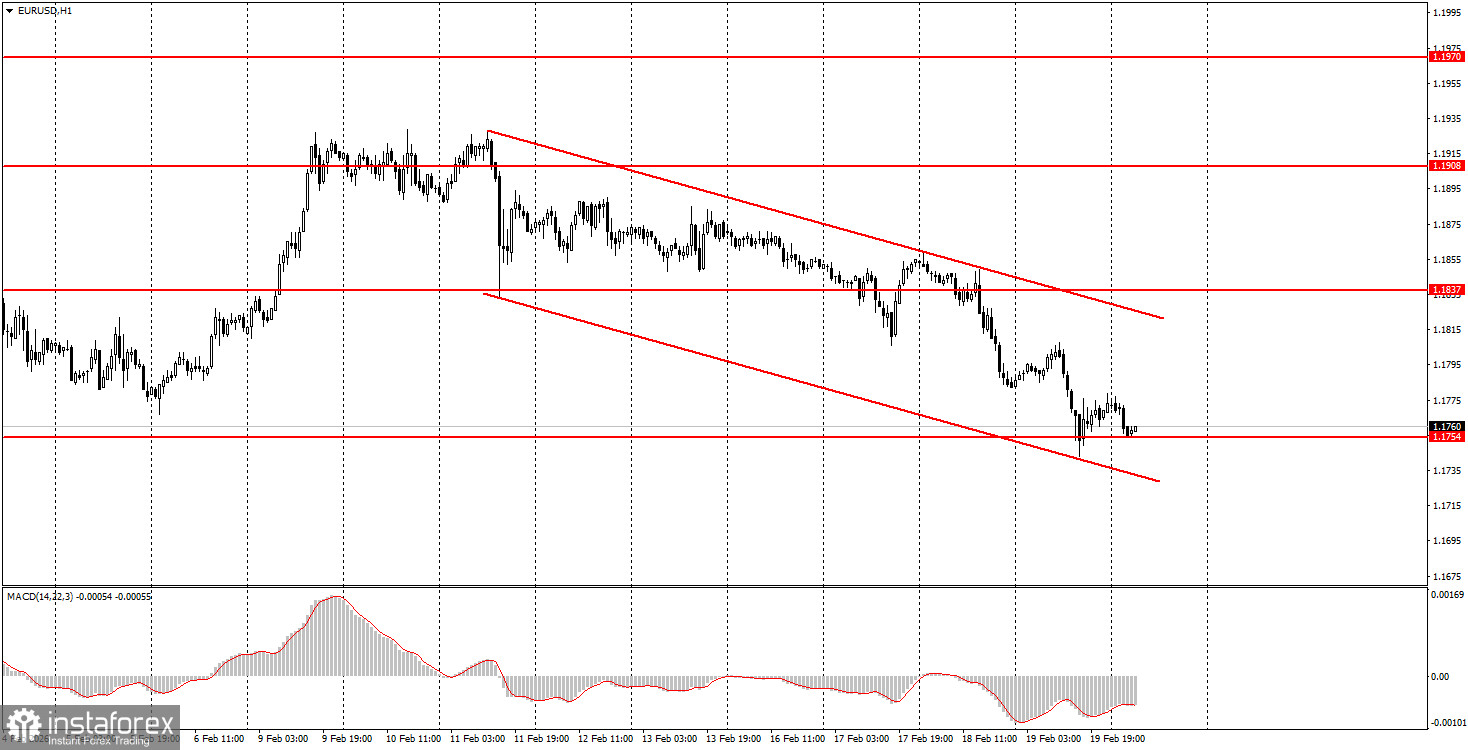
The EUR/USD currency pair traded lower again on Thursday, with no compelling reasons for this movement. The US dollar has been rising out of inertia, while the fundamental or macroeconomic basis for such movement raises serious questions. While there were sufficient reasons for the decline of the British currency this week, the euro has none. The dollar's strength can be attributed to a few less significant US reports that indeed came in better than expected. However, only the unemployment claims report was published yesterday, and the dollar rose by another 50 pips even before its release. Thus, the current movements can only be explained by technical factors, primarily on lower timeframes. On the hourly timeframe, we see a downward trend supported by a descending channel. The price is moving within this channel. Meanwhile, on the daily timeframe, a global upward trend persists.
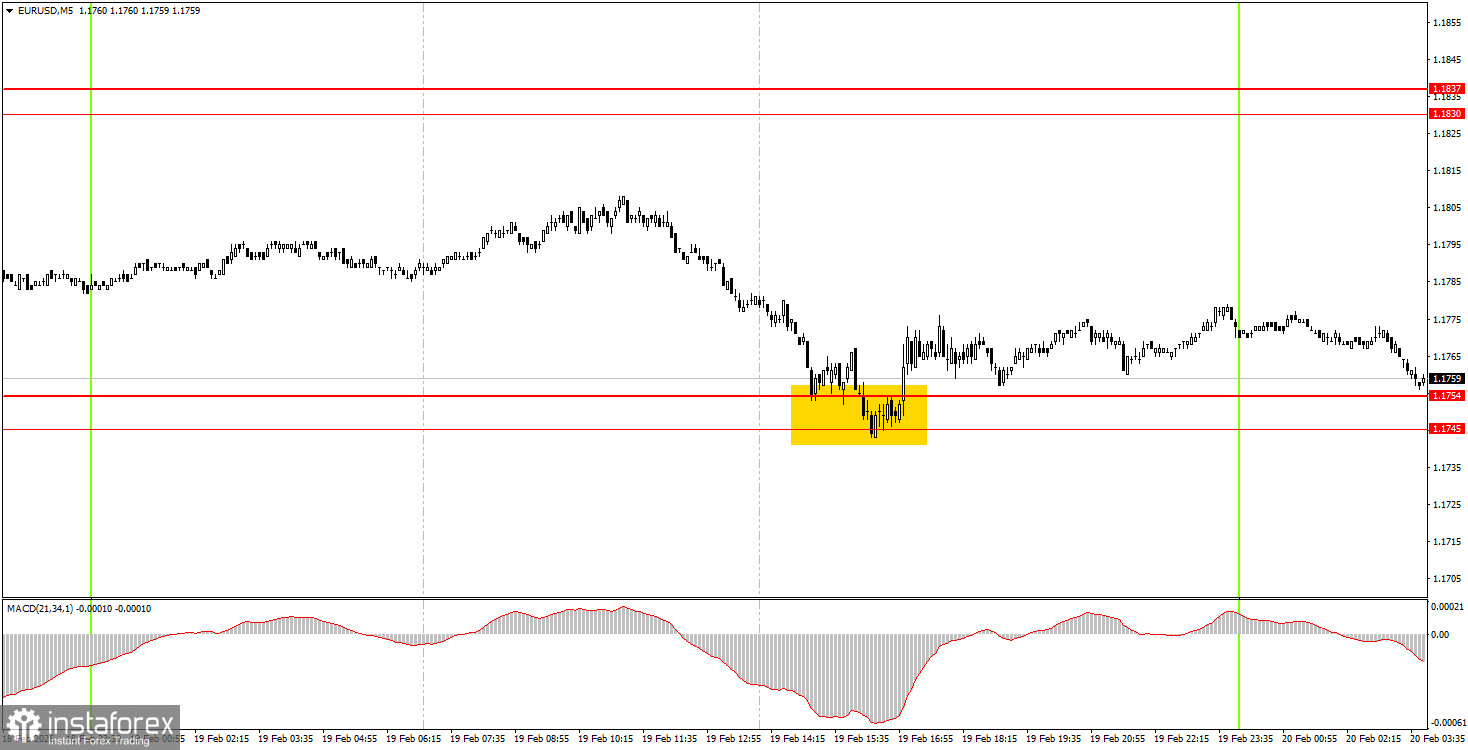
On the 5-minute timeframe, only one trading signal was formed on Thursday. During the American trading session, the pair reacted and bounced off the 1.1745-1.1754 range. The rise in quotes after this signal was very weak, and the price reached the indicated area following a sell signal generated on Wednesday around 1.1830-1.1837.
On the hourly timeframe, a downward correction remains, which may soon transform into an upward trend. At the beginning of 2026, a long-term upward trend resumed, so we are expecting new growth for the euro. The overall fundamental backdrop remains very challenging for the US dollar, so we fully support further movement upward.
On Friday, beginner traders can consider new short positions if the price consolidates below the 1.1745-1.1754 area, targeting the 1.1655-1.1666 area. A rebound from the area of 1.1745-1.1754 would allow for the opening of long positions targeting 1.1830-1.1837.
On the 5-minute timeframe, levels to consider include: 1.1455-1.1474, 1.1527-1.1531, 1.1550, 1.1584-1.1591, 1.1655-1.1666, 1.1745-1.1754, 1.1830-1.1837, 1.1899-1.1908, 1.1970-1.1988, 1.2044-1.2056, 1.2092-1.2104. Today, interesting indices of business activity in the services and manufacturing sectors for February will be released in the Eurozone and Germany. In the US, there will also be business activity indices, along with the core PCE index, fourth-quarter preliminary GDP, the Michigan Consumer Sentiment Index, and personal income and spending data for American consumers. With so much news, volatility may be high today.


