

Актуальні патерни

Патерни - це графічні моделі, які "малюють" ціни на графіку. Один з постулатів технічного аналізу говорить нам про те, що історія (рух ціни) завжди повторюється. Це означає, що в схожих ситуаціях рух ціни, найчастіше, буде схожим, що дозволяє з високою часткою ймовірності спрогнозувати подальший розвиток ситуації.
Актуальні патерни від ІнстаФорекс - це зручний сервіс, який дозволить вам завжди бути в курсі останніх змін на ринку і вчасно реагувати на підказки, що з'явилися, від ринку. У нашому сервісі ви завжди знайдете найсвіжіші і актуальніші патерни на будь-якій парі і на будь-якому таймфреймі.
Прямоугольник
сформирован 11.04 в 15:08:43 (UTC+0)
сила сигнала 4 из 5
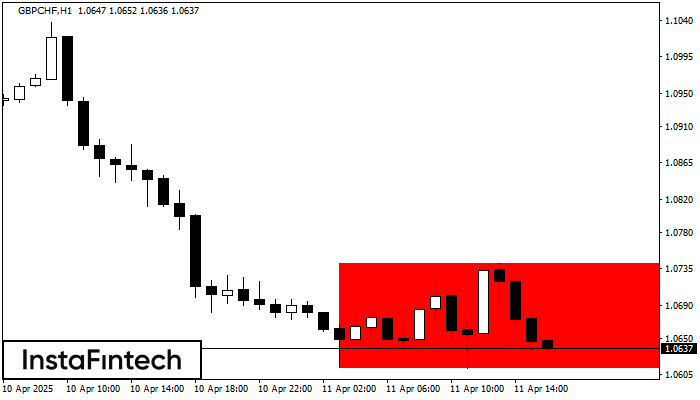
Сформирована фигура «Прямоугольник» на графике GBPCHF H1. Тип фигуры: Продолжение тренда; Границы: Верхняя 1.0742, Нижняя 1.0613; Сигнал: позиция на продажу открывается после фиксации цены ниже границы прямоугольника 1.0613.


