Прямоугольник
сформирован 11.04 в 15:08:43 (UTC+0)
сила сигнала 4 из 5

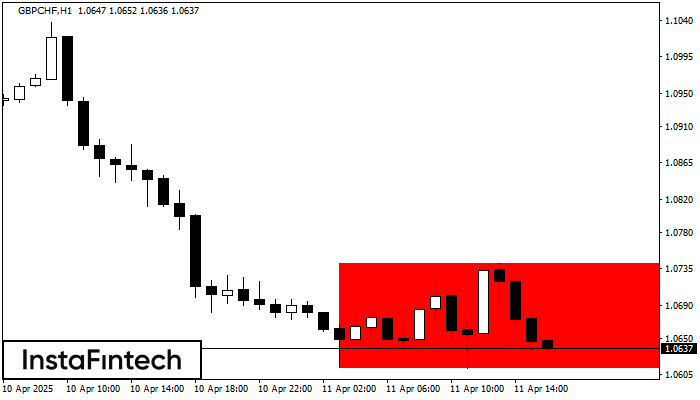
Сформирована фигура «Прямоугольник» на графике GBPCHF H1. Тип фигуры: Продолжение тренда; Границы: Верхняя 1.0742, Нижняя 1.0613; Сигнал: позиция на продажу открывается после фиксации цены ниже границы прямоугольника 1.0613.
- Все
- Все
- Bearish Rectangle
- Bearish Symmetrical Triangle
- Bullish Rectangle
- Double Top
- Double Top
- Triple Bottom
- Triple Bottom
- Triple Top
- Triple Top
- Все
- Все
- Покупка
- Продажа
- Все
- 1
- 2
- 3
- 4
- 5
Double Bottom
was formed on 08.07 at 20:00:35 (UTC+0)
signal strength 2 of 5
The Double Bottom pattern has been formed on #NTDOY M15. Characteristics: the support level 22.14; the resistance level 22.25; the width of the pattern 11 points. If the resistance level
The M5 and M15 time frames may have more false entry points.
Open chart in a new window
Double Bottom
was formed on 08.07 at 20:00:35 (UTC+0)
signal strength 3 of 5
The Double Bottom pattern has been formed on #NTDOY M30. Characteristics: the support level 22.14; the resistance level 22.25; the width of the pattern 11 points. If the resistance level
Open chart in a new window
Double Bottom
was formed on 08.07 at 20:00:32 (UTC+0)
signal strength 3 of 5
The Double Bottom pattern has been formed on #NTDOY M30. Characteristics: the support level 22.14; the resistance level 22.25; the width of the pattern 11 points. If the resistance level
Open chart in a new window