
Vea también


 15.07.2026 05:21 AM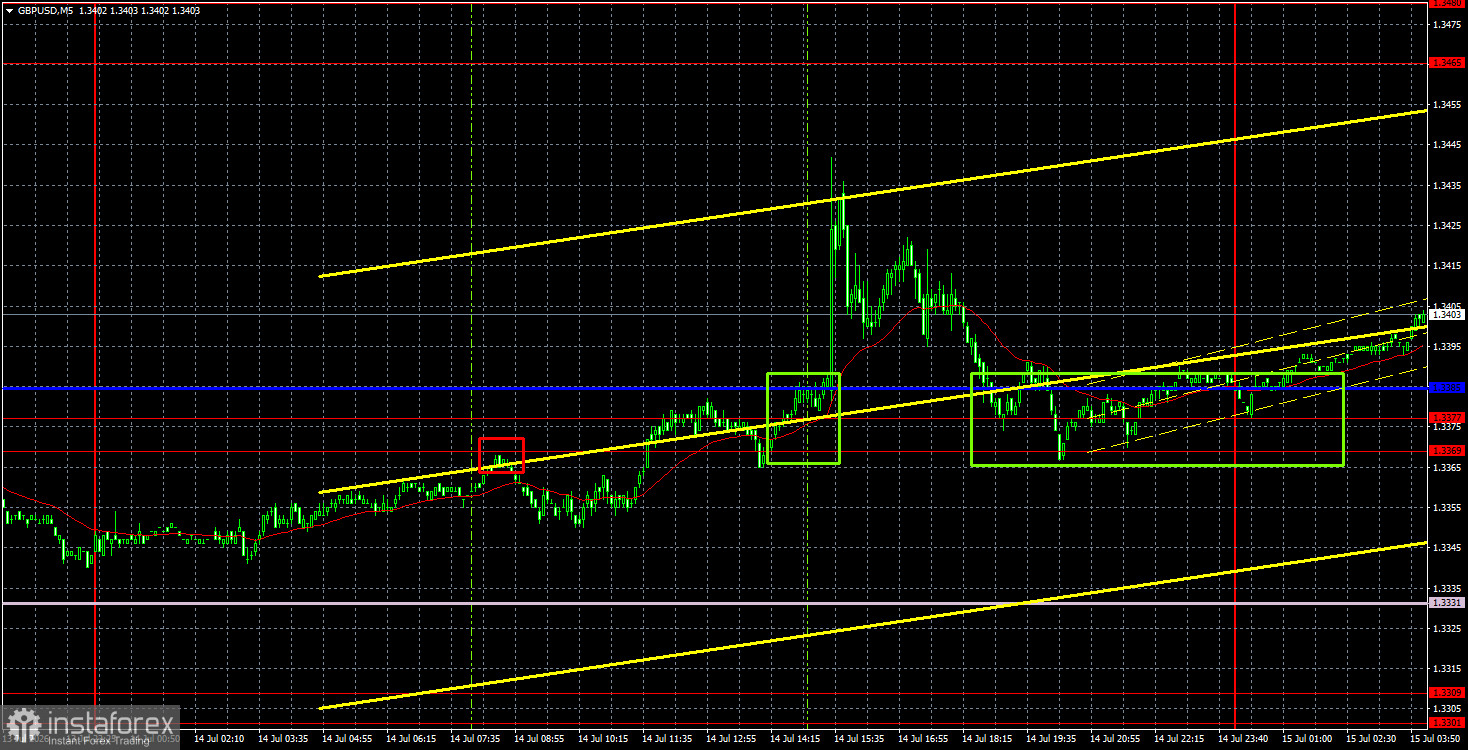
The GBP/USD currency pair traded only after the release of the U.S. inflation report on Tuesday. Once the report was published, the price immediately surged, but by the end of the day it had easily and freely returned to its original levels. Thus, in essence, there were no changes for the dollar even after an important and high-profile report. The Consumer Price Index slowed to 3.5%, which is below economists' forecasts; however, this slowdown did not pose major problems for the dollar. As for Kevin Warsh's speech in Congress, it largely mirrored the remarks made by the Federal Reserve Chair immediately following the June meeting. Warsh reiterated the unacceptability of high inflation, labeling it a "tax on citizens and households," promising to fundamentally change the Fed's operations and bring inflation back to target levels. There were no hints at tightening monetary policy. Since nothing new was announced by the Fed Chair, traders did not react at all to his speech.
From a technical perspective, the British pound may be set for a near-term decline. The ascending trend line has been breached, and now the price is supported only by the Senkou Span B line. If that line is breached as well, the decline in the British currency will continue. However, in the medium term, we still expect growth within a sideways channel on higher timeframes.
On the 5-minute timeframe, three trading signals were generated on Tuesday. At the very beginning of the European trading session, the price bounced from the 1.3369-1.3377 area, but the signal proved false. At the start of the American trading session, a buy signal formed, but it was extremely difficult to enter the market following the inflation report. During the night, the price bounced from the 1.3369-1.3377 area, suggesting potential growth in the British pound.
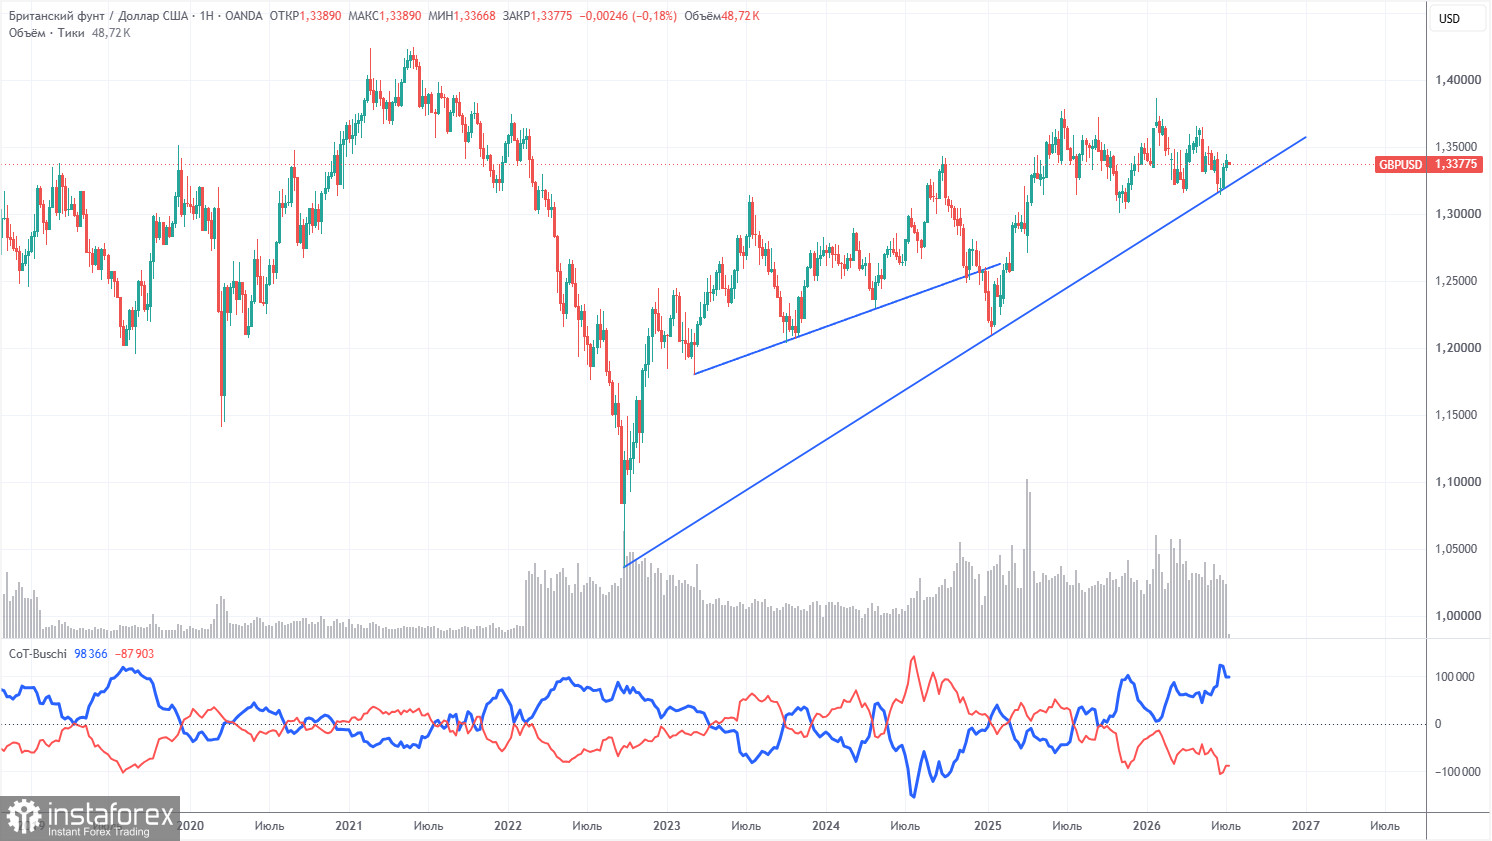
The latest COT report for the British pound indicates that non-commercial traders have dominated the market with sales for several months. The net position is negative, despite the long-term upward trend being maintained. Given the events in the Middle East, it is not surprising that demand for risk currencies remains weak. The war is formally over, but the conflict persists. Geopolitics may support the demand for the U.S. dollar in the near term. However, we would not expect a strong decline in the pair until it consolidates below the trend line.
In the long term, the dollar will continue to decline due to Donald Trump's policies, which is clearly visible on the weekly timeframe (illustration above). The trade war will continue in one form or another for a considerable time, and Trump's policies are aimed, directly and indirectly, at weakening the American currency. The long-term upward trend remains, as indicated by the trend line. The price recently interacted with this line and bounced off it. According to the latest COT report (dated July 7), the "Non-commercial" group opened 7,400 BUY contracts and closed 6,800 SELL contracts. Thus, the net position for non-commercial traders increased by 14,200 contracts over the week, which does not significantly affect the overall sentiment of professional players.
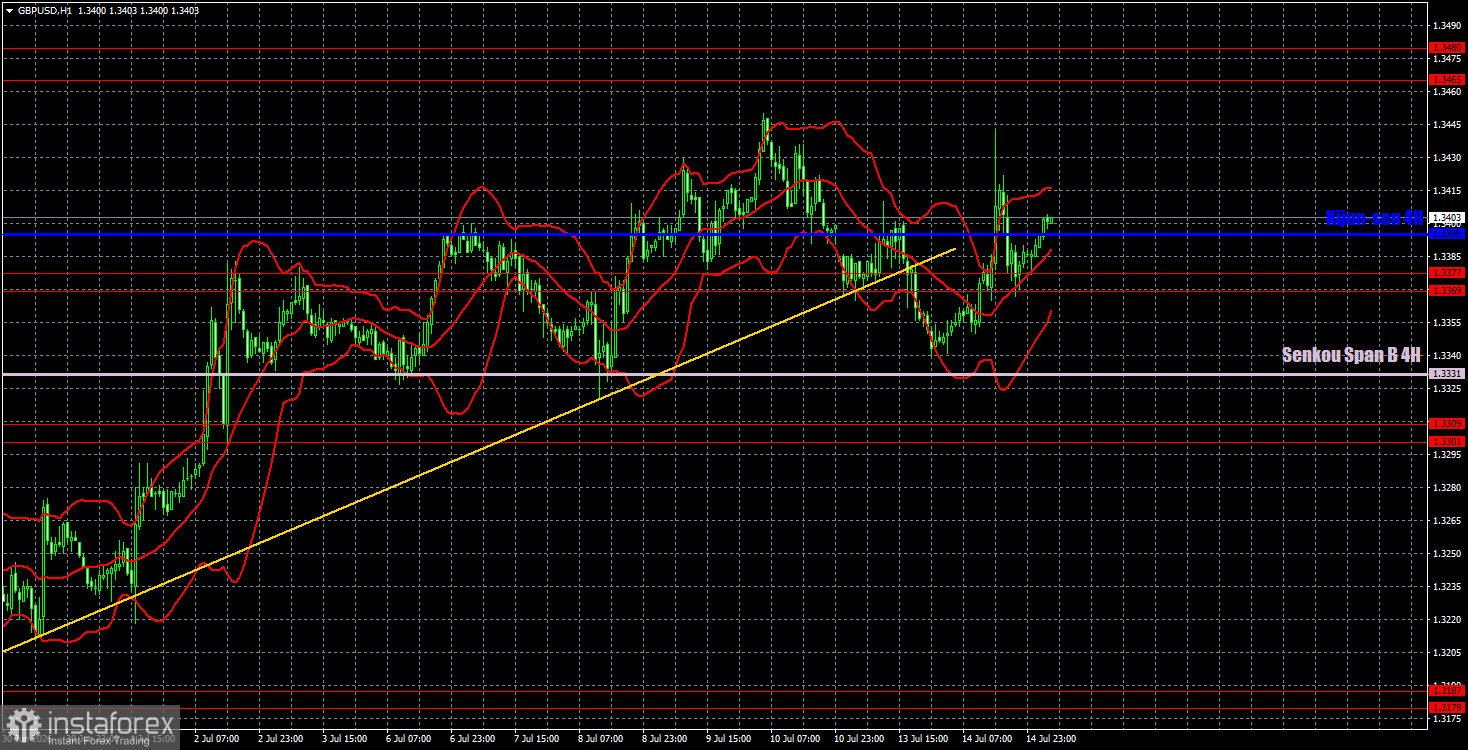
On the hourly timeframe, the GBP/USD pair may begin a new downward trend or at least a correction. The market has recently ignored most fundamental, geopolitical, and macroeconomic events, while on the daily timeframe, the pair has begun moving from the lower boundary of the sideways channel to the upper boundary. Therefore, in the medium term, we still expect upward movement. However, we may observe a technical correction soon, as the pair has risen for more than two consecutive weeks.
For July 15, we highlight the following important levels: 1.3042-1.3050, 1.3096-1.3115, 1.3179-1.3187, 1.3301-1.3309, 1.3369-1.3377, 1.3465-1.3480, 1.3588, and 1.3671-1.3681. The Senkou Span B line (1.3331) and Kijun-sen line (1.3395) may also serve as sources for signals. It is recommended to set stop-loss orders to break even if the price moves in the right direction by 20 pips. The Ichimoku indicator lines may shift during the day, which should be taken into account when determining trading signals.
On Wednesday, there are no notable events scheduled in the UK, while in the U.S., the Producer Price Index will be published and Warsh will deliver his second speech to Congress. We believe these events will have no impact on the pair's movements. Most likely, we are in for low volatility again today.
Today, traders may consider short positions targeting the Senkou Span B line and the 1.3301-1.3309 area if the pair consolidates below 1.3369-1.3377. Long positions remain relevant after a bounce from the area of 1.3369-1.3377, targeting the area of 1.3465-1.3480.


