empty
08.04.2025 03:47 AM
Trading Recommendations and Analysis for EUR/USD on April 8: The Storm Continues

EUR/USD 5-Minute Analysis

This image is no longer relevant

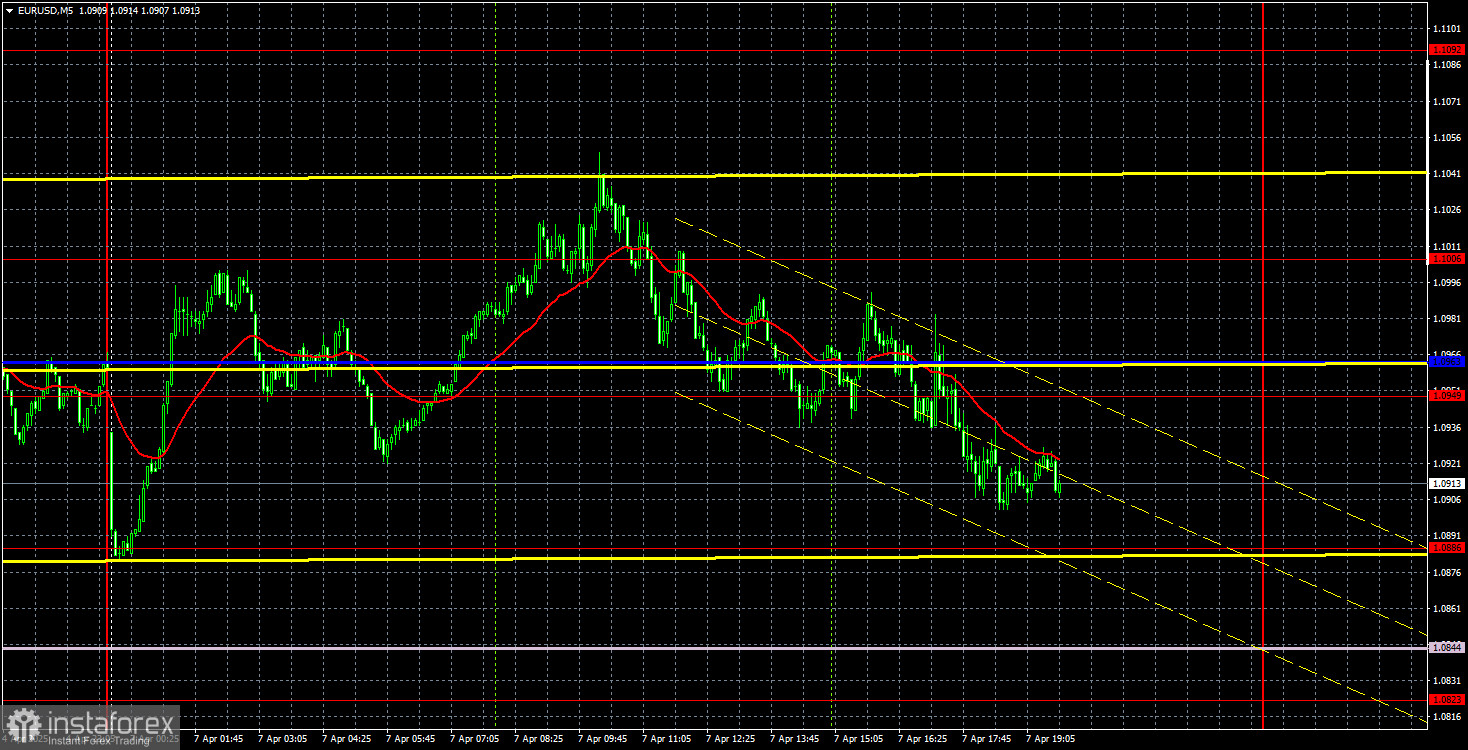
The EUR/USD currency pair continued to swing wildly back and forth. Neither currency has shown clear growth, but it's important to understand that the markets are currently in chaos. Trying to profit from chaos is not the best decision. It is better to wait for the markets to stabilize, although it is difficult to predict when that will occur. We're not discouraging anyone from opening trades or claiming it's impossible to make money right now. However, our reviews always stress that market movements should be technical, understandable, and explainable. If the price changes direction five times a day, news comes out every hour, and volatility hits 200 pips, can such movements be considered understandable and predictable?

On Monday, two reports (on retail sales in the EU and industrial production in Germany) were published in the Eurozone. It hardly needs to be said that they had no chance of influencing the EUR/USD pair's movement from the outset. On Monday—which many have already dubbed "Black Monday"—all markets collapsed again, causing chaos, panic, and turmoil. Amid everything happening globally, traders weren't interested in Germany's industrial output.

We haven't marked any trading signals on the 5-minute timeframe for the second day. There's no point, as the price constantly changes direction, ignoring all technical levels and lines. In our view, waiting until there is at least a minor emotional cooldown is advisable. However, that will only be possible once the tariff situation reaches some level of stability—when Trump stops imposing, canceling, or suspending tariffs. We also need to wait for all U.S. trading partners (if they can still be called that) to make their counter-decisions, after which it will become clearer what actions Trump plans to take in response. It's unlikely we'll see calm market movements anytime soon.

COT Report

This image is no longer relevant

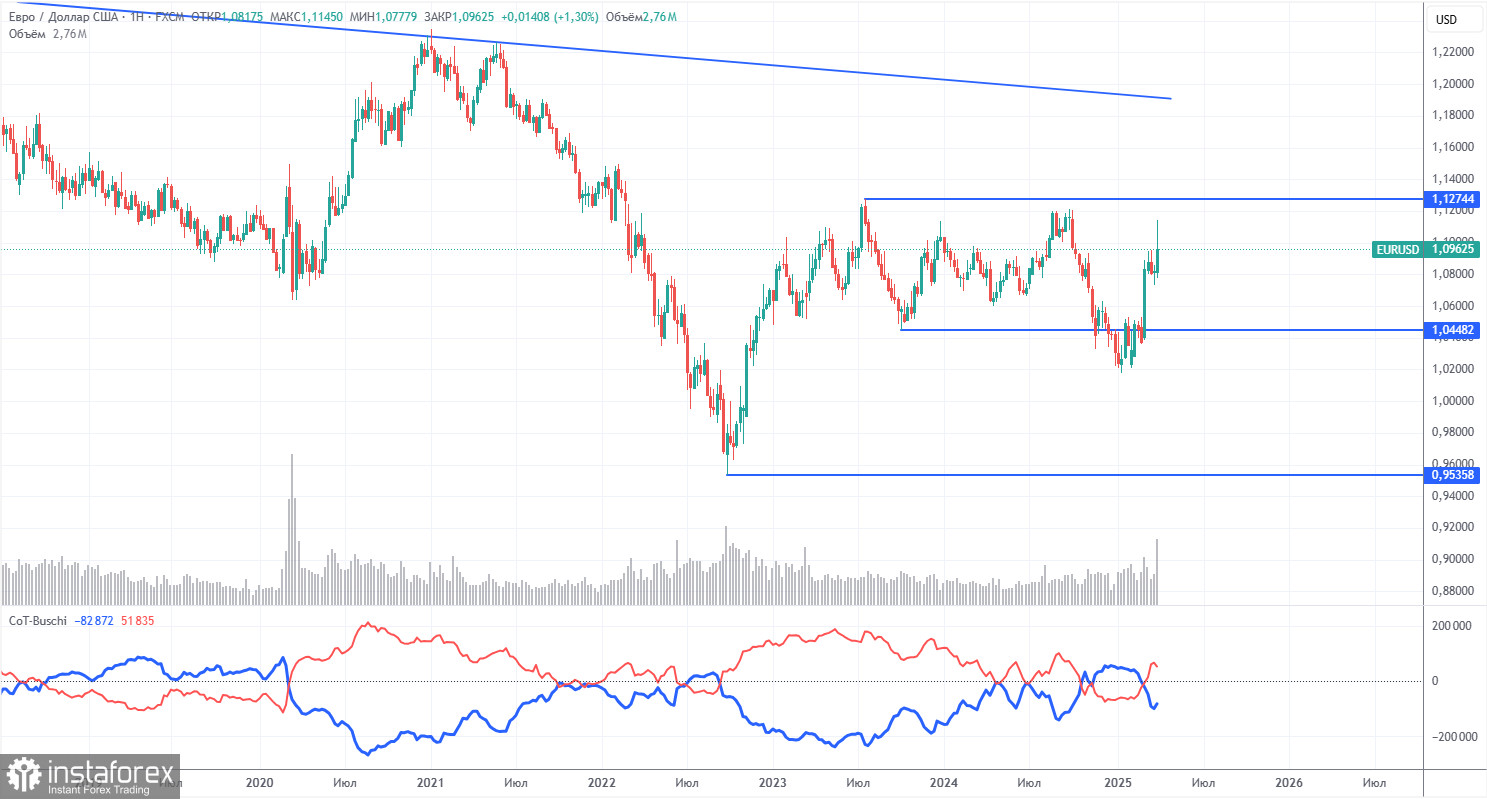
The latest COT report is dated April 1. As shown in the chart, the net position of non-commercial traders remained bullish for a long time. The bears barely managed to gain control briefly, but now the bulls are back in charge. The bears' advantage has faded fast since Trump took office, and the dollar has since plunged. We cannot say definitively that the dollar's decline will continue, and the COT reports reflect sentiment among major players, which can shift quickly in today's environment.

We still see no fundamental factors supporting euro strength—but one decisive factor for dollar weakness has emerged. The correction may last for weeks or even months, but a 16-year downward trend isn't going to end so quickly.

The red and blue lines have crossed again, indicating a bullish market trend. During the latest reporting week, the number of long positions in the "non-commercial" group fell by 6,500, while short positions increased by 7,100. As a result, the net position declined by 13,600 contracts.

EUR/USD 1-Hour Analysis

This image is no longer relevant

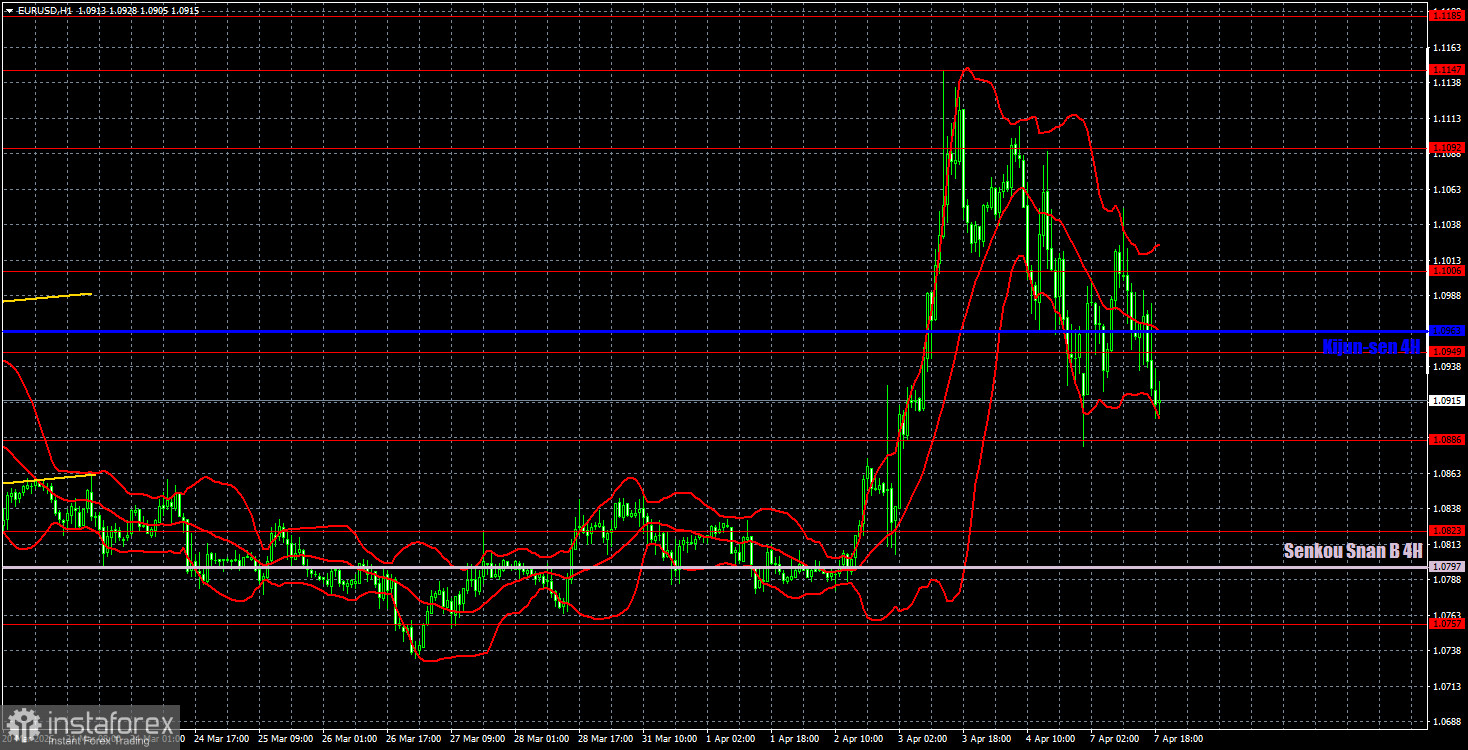
The EUR/USD pair quickly resumed its upward movement in the hourly time frame when Trump began implementing new tariffs. We believe that a medium-term decline will eventually resume due to the divergence in monetary policy between the ECB and the Fed. However, it's unclear how long the market will continue to price in the "Trump factor" alone. Currently, panic and chaos dominate the markets, so if we previously refrained from making price movement forecasts, we do so even more now. Our only recommendation is to wait until the "crisis" either passes or at least begins to subside.

For April 8, we highlight the following levels for trading: 1.0461, 1.0524, 1.0585, 1.0658–1.0669, 1.0757, 1.0797, 1.0823, 1.0886, 1.0949, 1.1006, 1.1092, 1.1147, 1.1185, 1.1234, as well as the Senkou Span B line (1.0797) and the Kijun-sen line (1.0963). Remember that Ichimoku indicator lines can shift during the day, which must be factored in when identifying trading signals. Also, don't forget to move the Stop Loss to breakeven once the price moves 15 pips in the right direction. This will help protect against potential losses if the signal is false.

No significant macroeconomic events or data releases are scheduled in the Eurozone or the U.S. on Tuesday. However, that doesn't mean there won't be news from Trump, who is reportedly considering a 90-day suspension of tariffs. Therefore, we could be in for the next episode of the series "The New World Order and Its Consequences."

Illustration Explanations:

  • Support and Resistance Levels (thick red lines): Thick red lines indicate where movement may come to an end. Please note that these lines are not sources of trading signals.
  • Kijun-sen and Senkou Span B Lines: Ichimoku indicator lines transferred from the 4-hour timeframe to the hourly timeframe. These are strong lines.
  • Extreme Levels (thin red lines): Thin red lines where the price has previously bounced. These serve as sources of trading signals.
  • Yellow Lines: Trendlines, trend channels, or any other technical patterns.
  • Indicator 1 on COT Charts: Represents the net position size for each category of traders.

Recommended Stories

GBP/USD plan para la sesión europea el 8 de julio. Informes Commitment of Traders COT (análisis de las operaciones de ayer). La libra está lista para continuar cayendo

Ayer se formaron varios puntos de entrada al mercado. Veamos el gráfico de 5 minutos y analicemos lo que ocurrió. En mi pronóstico de la mañana presté atención al nivel

Miroslaw Bawulski 07:55 2025-07-08 UTC+2

EUR/USD plan para la sesión europea el 8 de julio. Informes Commitment of Traders COT (análisis de las operaciones de ayer). El euro no tiene intención de caer por mucho tiempo

EUR/USD plan para la sesión europea el 8 de julio. Informes Commitment of Traders COT (análisis de las operaciones de ayer). El euro no tiene intención de caer por mucho

Miroslaw Bawulski 07:54 2025-07-08 UTC+2

EUR/USD: plan para la sesión estadounidense del 7 de julio (análisis de las operaciones de la mañana) El euro sigue bajo presión

En mi pronóstico de la mañana presté atención al nivel de 1.1749 y planeé tomar decisiones de entrada al mercado desde ese punto. Veamos el gráfico de 5 minutos

Miroslaw Bawulski 13:01 2025-07-07 UTC+2

GBPUSD: plan para la sesión europea del 04 de julio. Informes Commitment of Traders COT (análisis de las operaciones de ayer). La presión sobre la libra se mantiene

Ayer se formaron varios puntos de entrada al mercado. Veamos el gráfico de 5 minutos y analicemos lo que ocurrió. En mi pronóstico matutino presté atención al nivel de 1.3659

Miroslaw Bawulski 07:40 2025-07-04 UTC+2

EURUSD: plan para la sesión europea del 04 de julio. Informes Commitment of Traders COT (análisis de las operaciones de ayer). El dólar se fortaleció tras los sólidos datos del mercado laboral

EURUSD: plan para la sesión europea del 04 de julio. Informes Commitment of Traders COT (análisis de las operaciones de ayer). El dólar se fortaleció tras los sólidos datos

Miroslaw Bawulski 07:40 2025-07-04 UTC+2

GBPUSD: plan para la sesión europea del 03 de julio. Informes Commitment of Traders COT (análisis de las operaciones de ayer). El par GBP/USD se desplomó ante problemas políticos

Ayer se formaron varios puntos de entrada al mercado. Veamos el gráfico de 5 minutos y analicemos lo que ocurrió allí. En mi pronóstico matutino, presté atención al nivel 1.3713

Miroslaw Bawulski 07:32 2025-07-03 UTC+2

EUR/USD: plan para la sesión europea del 03 de julio. Informes Commitment of Traders COT (análisis de las operaciones de ayer). El dólar volvió a caer tras el informe de ADP

EUR/USD: plan para la sesión europea del 03 de julio. Informes Commitment of Traders COT (análisis de las operaciones de ayer). El dólar volvió a caer tras el informe

Miroslaw Bawulski 07:32 2025-07-03 UTC+2

GBP/USD: plan para la sesión europea del 01 de julio. Informes Commitment of Traders COT (análisis de las operaciones de ayer). La libra fue objeto de una gran venta

Ayer se formaron varios puntos de entrada al mercado. Veamos el gráfico de 5 minutos y analicemos lo que ocurrió. En mi pronóstico matutino, presté atención al nivel 1.3766

Miroslaw Bawulski 07:55 2025-07-02 UTC+2

EUR/USD: plan para la sesión europea del 02 de julio. Informes Commitment of Traders COT (análisis de las operaciones de ayer). El euro retrocedió desde el máximo mensual

Ayer se formaron varios puntos de entrada al mercado. Veamos el gráfico de 5 minutos y analicemos lo que ocurrió. En mi pronóstico matutino, presté atención al nivel 1.1806

Miroslaw Bawulski 07:55 2025-07-02 UTC+2

GBP/USD: plan para la sesión europea del 01 de julio. Informes Commitment of Traders COT (análisis de las operaciones de ayer). La libra continúa su crecimiento

Ayer se formaron varios puntos de entrada al mercado. Veamos el gráfico de 5 minutos y analicemos lo que ocurrió. En mi pronóstico matutino presté atención al nivel 1.3723

Miroslaw Bawulski 07:05 2025-07-01 UTC+2
¿No puede hablar ahora mismo?
Ingrese su pregunta en el chat.
 

Dear visitor,

Your IP address shows that you are currently located in the USA. If you are a resident of the United States, you are prohibited from using the services of InstaFintech Group including online trading, online transfers, deposit/withdrawal of funds, etc.

If you think you are seeing this message by mistake and your location is not the US, kindly proceed to the website. Otherwise, you must leave the website in order to comply with government restrictions.

Why does your IP address show your location as the USA?

  • - you are using a VPN provided by a hosting company based in the United States;
  • - your IP does not have proper WHOIS records;
  • - an error occurred in the WHOIS geolocation database.

Please confirm whether you are a US resident or not by clicking the relevant button below. If you choose the wrong option, being a US resident, you will not be able to open an account with InstaTrade anyway.

We are sorry for any inconvenience caused by this message.