
Veja também


 08.09.2026 07:31 AM
Bitcoin and Ether have spent several weeks in sideways trading following a sharp jump. Over the past two weeks both assets have traded in horizontal channels, and the higher time frame technical picture allows for the possibility of a fresh leg lower. The US Treasury's decision to expand long-term bond buybacks sparked the crypto market rally, but the question remains how long that move will last if it rests on a single supporting factor. The fundamental backdrop remains weak for the crypto segment, and downtrends in both Ether and Bitcoin have not been broken. We still see no grounds for a sustained advance. Sentiment around the crypto sector became much more optimistic in August, but traders should beware: this may be a pump or manipulation.
Meanwhile, BlackRock's head of digital assets research, Robert Mitchnick, said Bitcoin could return to its last all-time high by year-end. Mitchnik argued that high US public debt will push investors to view Treasuries with caution and that the US government will be forced into various stimulus measures. In practice most stimulus programs imply either an increase in money supply growth or a reduction in borrowing costs, which mechanically lowers yields on traditional financial instruments. At the same time, investors will search for alternatives as confidence in US Treasuries and the dollar is weak. One such alternative is Bitcoin, which many analysts now say is near the end of its four-year cycle. If that is the case, the downtrend could end soon or may already have ended.
It is also worth noting that the US Treasury has, in effect, already begun a stimulus-like operation aimed at reducing long-term yields. The Treasury will buy its own bonds and provide investors with additional cash flows that need to be allocated somewhere. The more bonds the Treasury buys, the more free capital investors may hold—and some portion of that liquidity could flow into Bitcoin.
Trading recommendations for BTC/USD
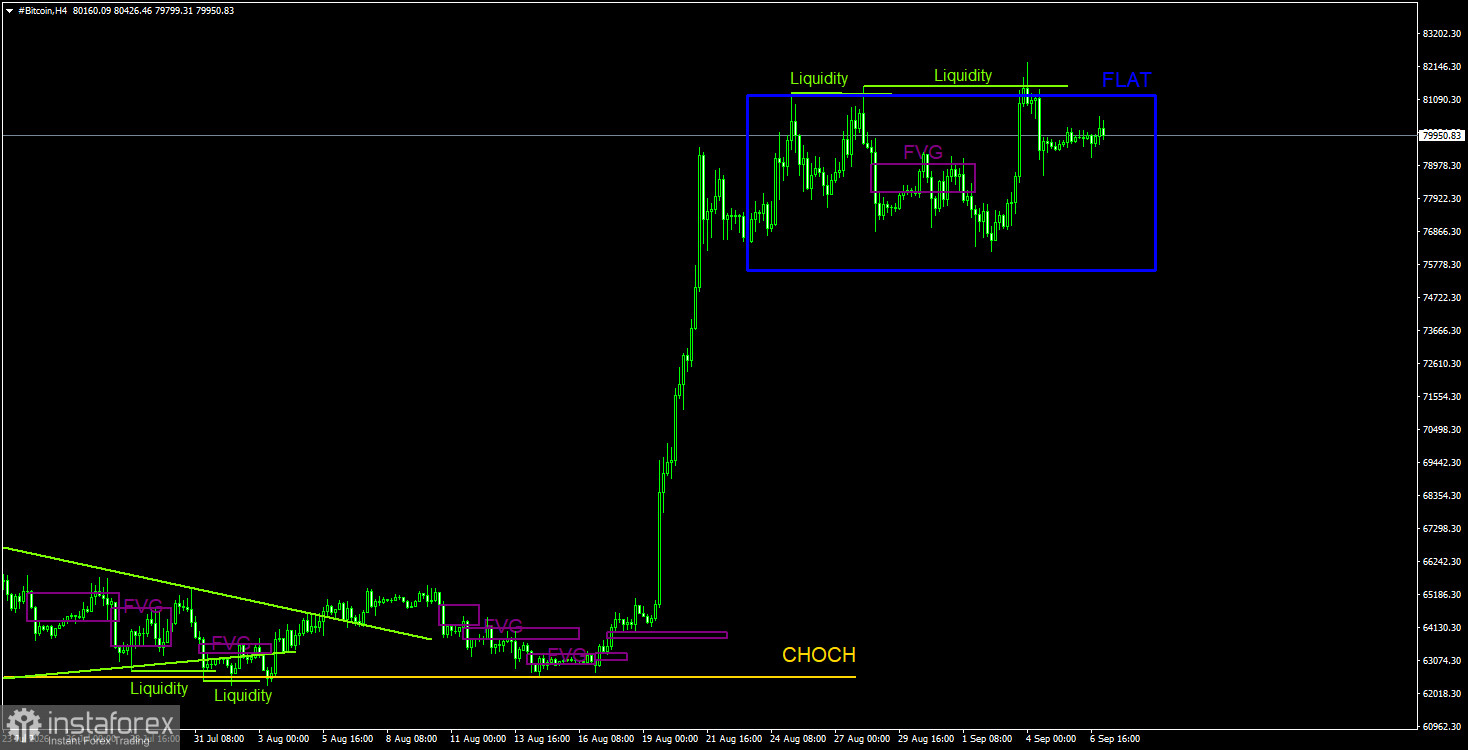
Bitcoin remains in a downtrend despite last week's strong rise. We continue to expect a decline toward $57,500 (the 61.8% Fibonacci retracement of the three-year uptrend), although that level has in effect already been worked off. Even so, we do not believe the downtrend is finished. The recent rise in Bitcoin looks only weakly like a corrective move and is not a convincing reason to open longs; it resembles a pump. Liquidity may be taken off the $82,850 peak, which could trigger a new leg down and confirm a transition to sideways trading. In the 4-hour time frame, expect another fall after a second liquidity grab at the recent highs (a deviation).
Trading recommendations for ETH/USD
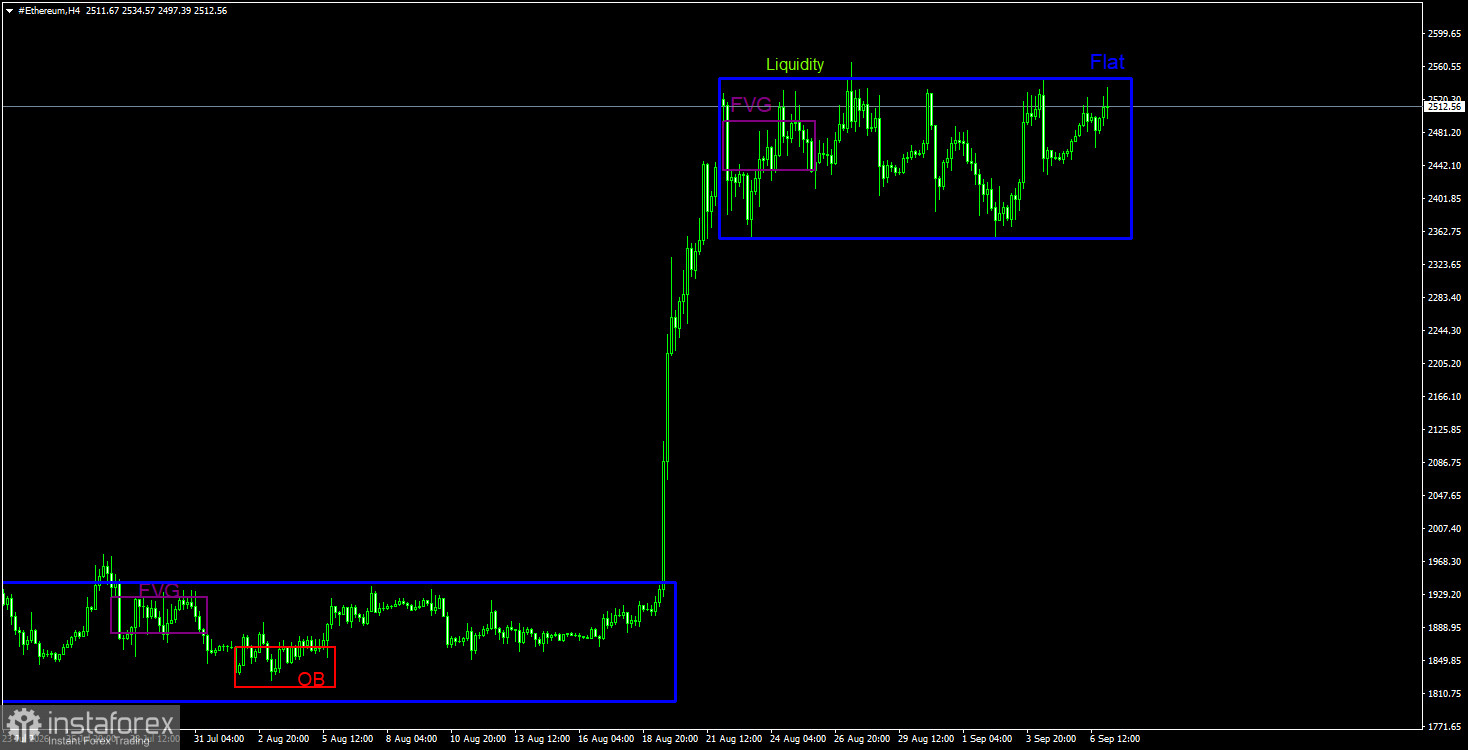
On the daily time frame, the technical picture for Ether has changed significantly in just a few days. Ether may now begin a new uptrend. However, traders should rely primarily on the weekly chart for positioning, where Ether could head toward $4,800, the upper boundary of a five-year sideways channel. On the daily chart the nearest bearish fair value gap (FVG) has been worked off, but that FVG belongs to the prior trend, and any reaction to it will most likely be corrective. We also note liquidity removal at the April 17 high and liquidity grabs on the 4-hour chart; Bitcoin likewise took liquidity on the 4-hour. Thus, a correction is likely, and a flat pattern has already formed on the 4-hour Ether chart. Within that flat, internal patterns have limited value; in the near term, one can only expect a move to the lower boundary of the flat.
Explanations of labels
CHOCH—a break in trend structure.
Liquidity—stop losses, pending orders, and other liquidity market makers use to build positions.
FVG—an area of price inefficiency that price moves through quickly when one side is absent; price later tends to return to such areas and react in continuation of the main trend.
IFVG—inverted fair value gap. After returning to such an area, the price does not react but instead breaks through impulsively and then retests from the other side.
OB—order block: a candle where a market maker entered to take liquidity and build a position in the opposite direction.


