یہ بھی دیکھیں

 16.02.2026 12:30 AM
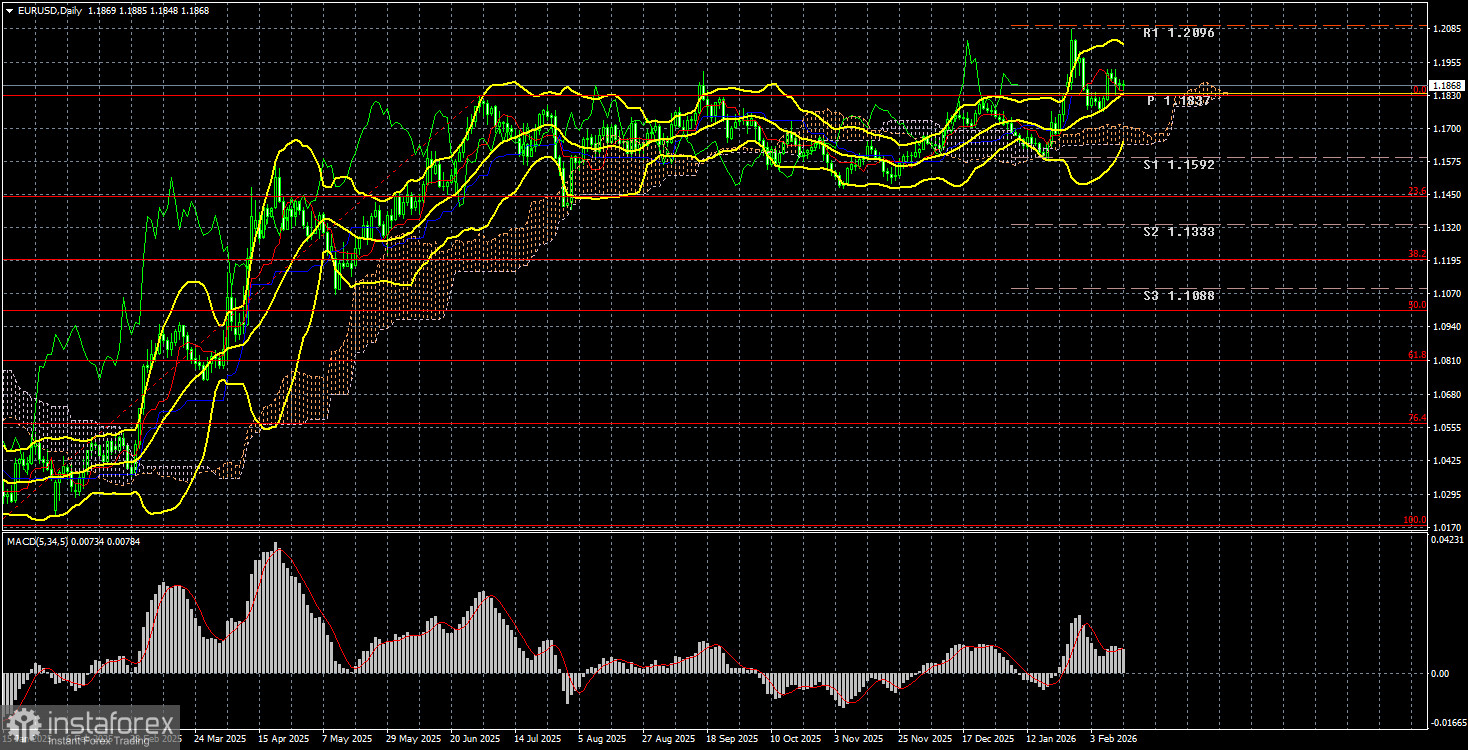
The EUR/USD currency pair spent much of the past week largely stagnant, with more instances of remaining in one place than moving in any direction. The current volatility chart clearly shows that the pair traded only on Monday and Wednesday. On Monday, the Chinese government announced a ban on the purchase of U.S. Treasury bonds. On Wednesday, the data on Non-Farm Payrolls and unemployment were released. On the remaining days, the pair's volatility did not exceed 41 pips.
It is perhaps best to begin not with Non-Farm Payrolls or unemployment data, but with news of China's sell-off of American Treasuries. In recent weeks, Beijing has sold approximately hundreds of billions of dollars in U.S. Treasury bonds, reducing its percentage of reserves in American Treasuries to a 20-year low. Instead of American debt securities, China is actively purchasing gold and silver. What does this indicate? The American economy is becoming increasingly unattractive to foreign investors, central banks, and even countries. If the U.S. economy previously symbolized stability, a bright future, growth, and profit, since Donald Trump's second term, investors have increasingly steered clear of anything related to America.
For the U.S. dollar, which has faced crisis after crisis over the past 13 months, this is yet another alarming signal. Demand for government bonds is falling, which could lead to a sharp rise in their yields. Subsequently, this will translate into an increase in the cost of servicing the debt, a greater burden on the budget, and galloping growth in national debt. America has become accustomed to living in debt, and without new loans, its development may significantly slow down.
The decline in demand for American Treasuries signifies a basic loss of trust in America and its international reputation as a country with the largest economy. China is responding to Trump's actions regarding trade policies between the two countries. China's actions could "infect" many other nations. If a country like China is shedding American securities in favor of safer assets and investments, other countries may follow suit. Trump stirred up a hornet's nest and mistakenly believed that no one would dare respond to America in kind.
Thus, from a long-term perspective, the fundamental backdrop for the U.S. dollar continues to deteriorate. Experts are already doubting the viability of Trump's trade tariffs and the trade war as a whole. According to estimates from the Congressional Budget Office, the national debt will grow over the next 10 years at an even faster rate than previously expected. The U.S. Congress has begun feeble attempts to block Trump's tariffs, as the Supreme Court cannot. Trump's approval ratings have dropped to 29%, the lowest value during both of his terms in office. The Congressional and Senate elections in November could significantly change the political landscape, likely not in favor of the Republicans.
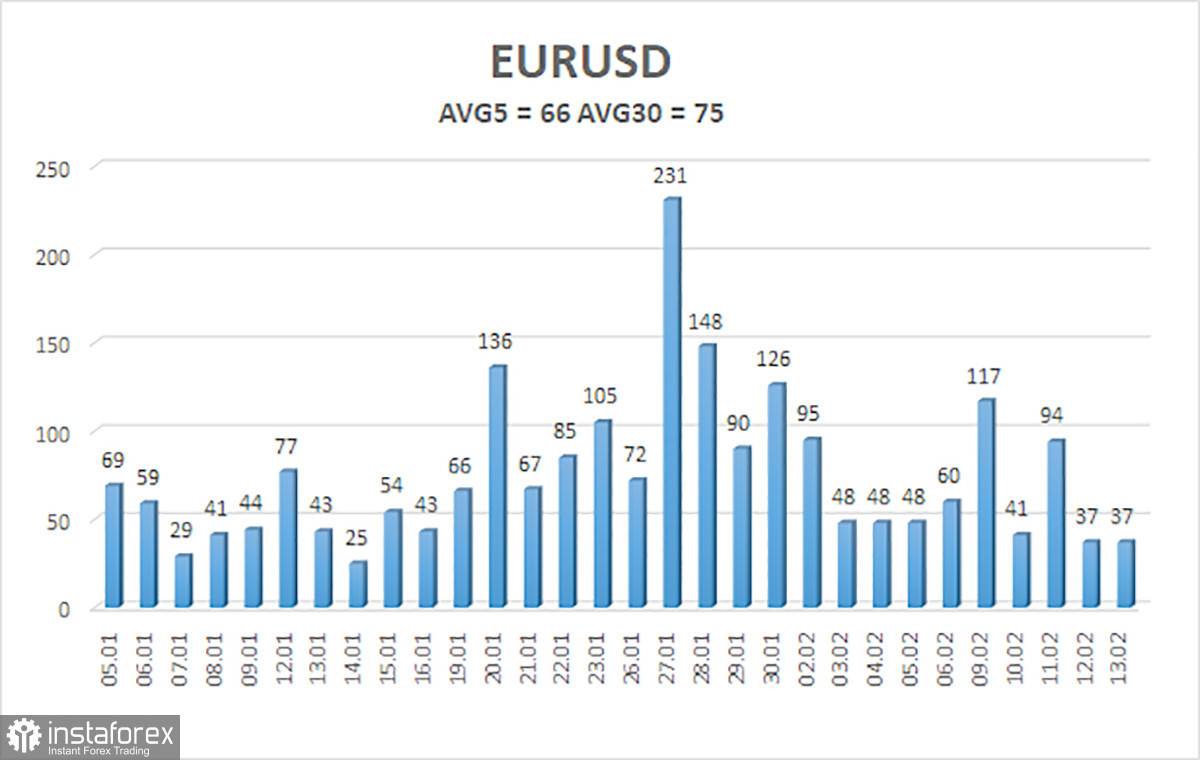
The average volatility of the EUR/USD pair over the last 5 trading days as of February 15 is 66 pips, which is considered "average." We expect the pair to trade between 1.1802 and 1.1934 on Monday. The upper channel of the linear regression is directed upwards, indicating a continued increase for the euro. The CCI indicator has entered the overbought territory, signaling a possible pullback.
The EUR/USD pair continues to correct within the upward trend. The global fundamental backdrop remains critically negative for the dollar. The pair has spent seven months in a sideways channel; it is likely now that the time has come to resume the global trend of 2025. There is no fundamental basis for the dollar's long-term growth. Therefore, all the dollar can hope for is a flat movement or corrections. With the price positioned below the moving average, small shorts can be considered with a target of 1.1719 on purely technical grounds. Above the moving average line, long positions remain relevant with targets of 1.1963 and 1.2085.


