यह भी देखें

 04.06.2026 09:12 AM
If Donald Trump is prepared to tolerate Iran's provocations, US equity markets have run out of patience. For a long time, US indices largely ignored geopolitics, supported by fiscal and monetary stimulus, strong corporate results, and the AI frenzy. But nothing lasts forever. Attacks by the Islamic Republic on Kuwait and Bahrain triggered a sell-off in the S&P 500. The extended winning streak fell just one day short of matching the 1995 run.
S&P 500 performance
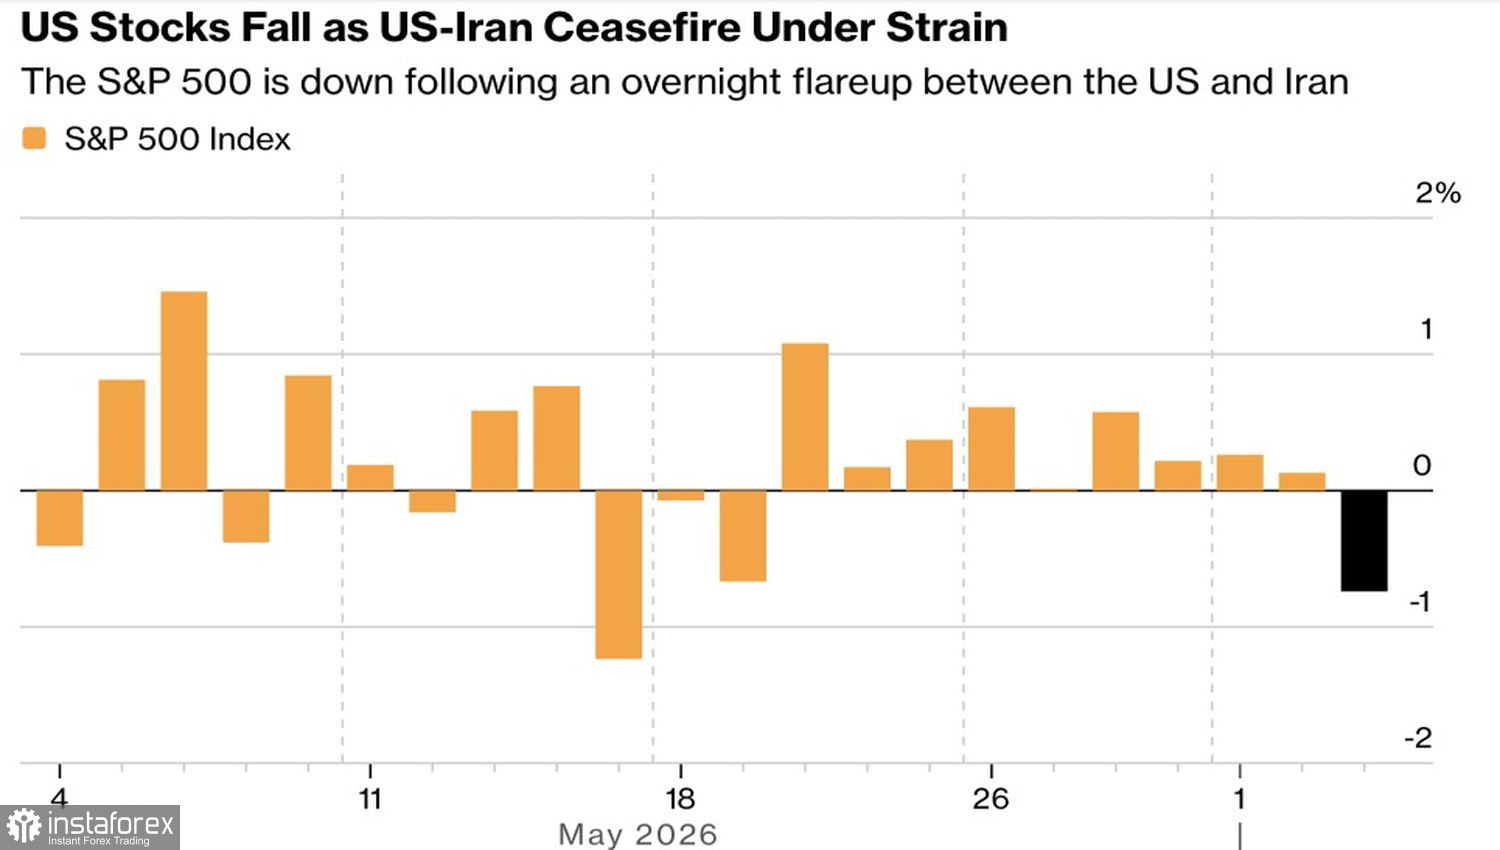
Despite the White House's insistence that the situation is under control and that talks with Iran continue, investors are re-assessing events in the Middle East. There is no ceasefire regime in place, rather a lower-intensity armed conflict than before. Hostilities are expanding, and Trump will return to mass bombing only if US service members start to die.
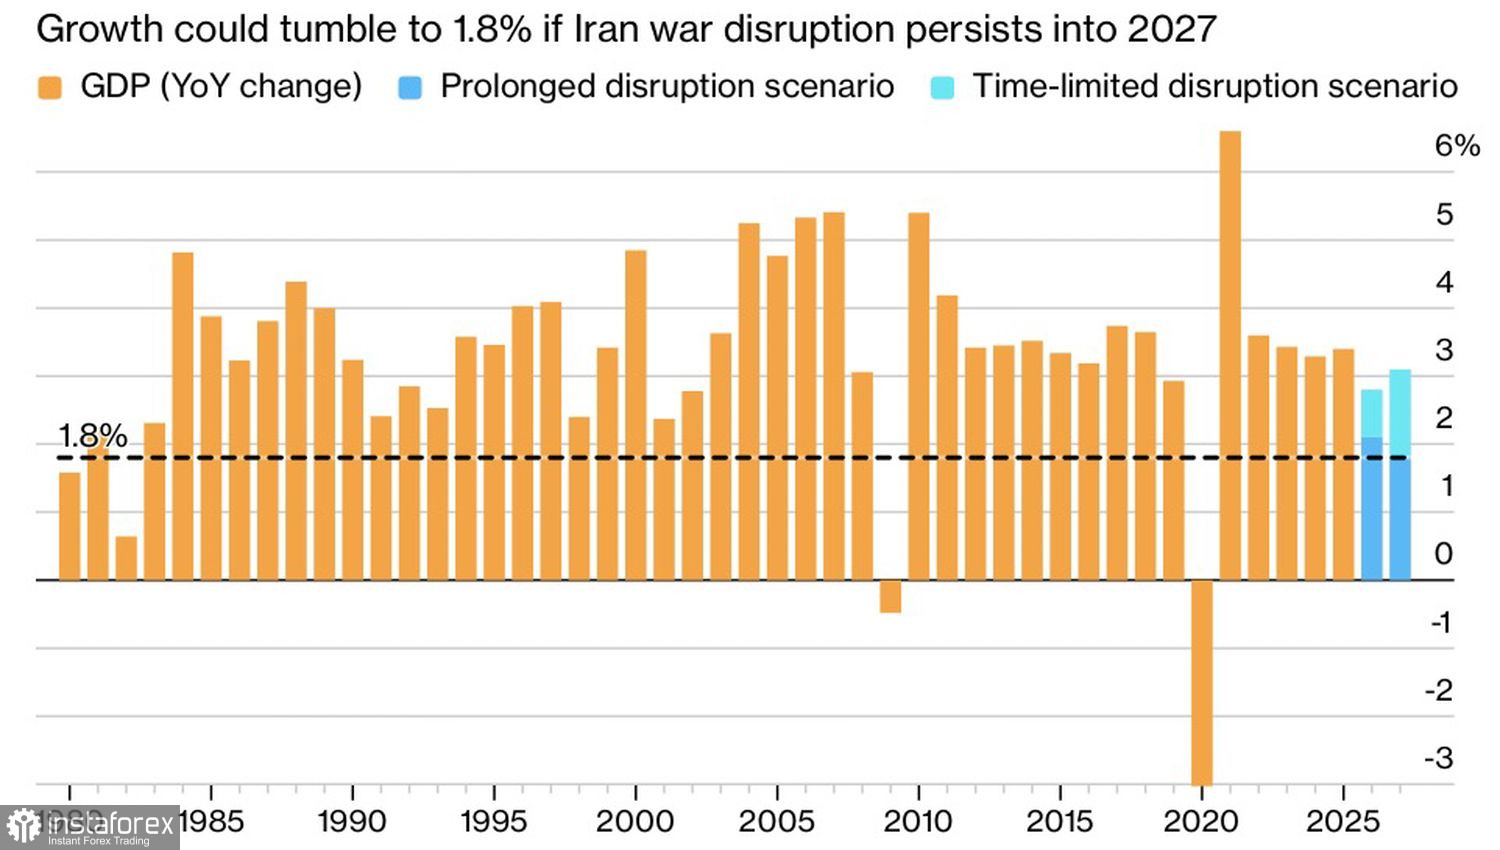
In any case, the Strait of Hormuz remains effectively closed and supply issues persist, which the OECD says could slow global GDP growth to 2.1%, the weakest pace since the pandemic. Inflation across the G20 would rise to 4.4% in 2026 and 4.7% in 2027. Central banks would be forced to raise interest rates on average by 50–75 bps. All of this threatens a global recession, and the S&P 500 must react.
Global growth dynamics and forecasts
It's hard to say which the US equity market should fear more: a global GDP slowdown or Fed tightening. The odds of a federal funds rate hike in 2026 have risen to 56% amid strong US macro prints and increasingly hawkish FOMC rhetoric. Dallas Fed President Lorie Logan warns that the central bank will resort to monetary restriction later in the year if inflation cannot be tamed.
In late 2025, weak US data were actually bullish for equities because they increased the odds of Fed cuts. At the start of summer, the process has reversed: strong ADP private sector payrolls and robust ISM services employment prints have become catalysts for the S&P 500 sell-off because they raise the likelihood of policy tightening.
Will the crowd use the pullback to buy the dip, or is this the start of a deeper correction? Time will tell.
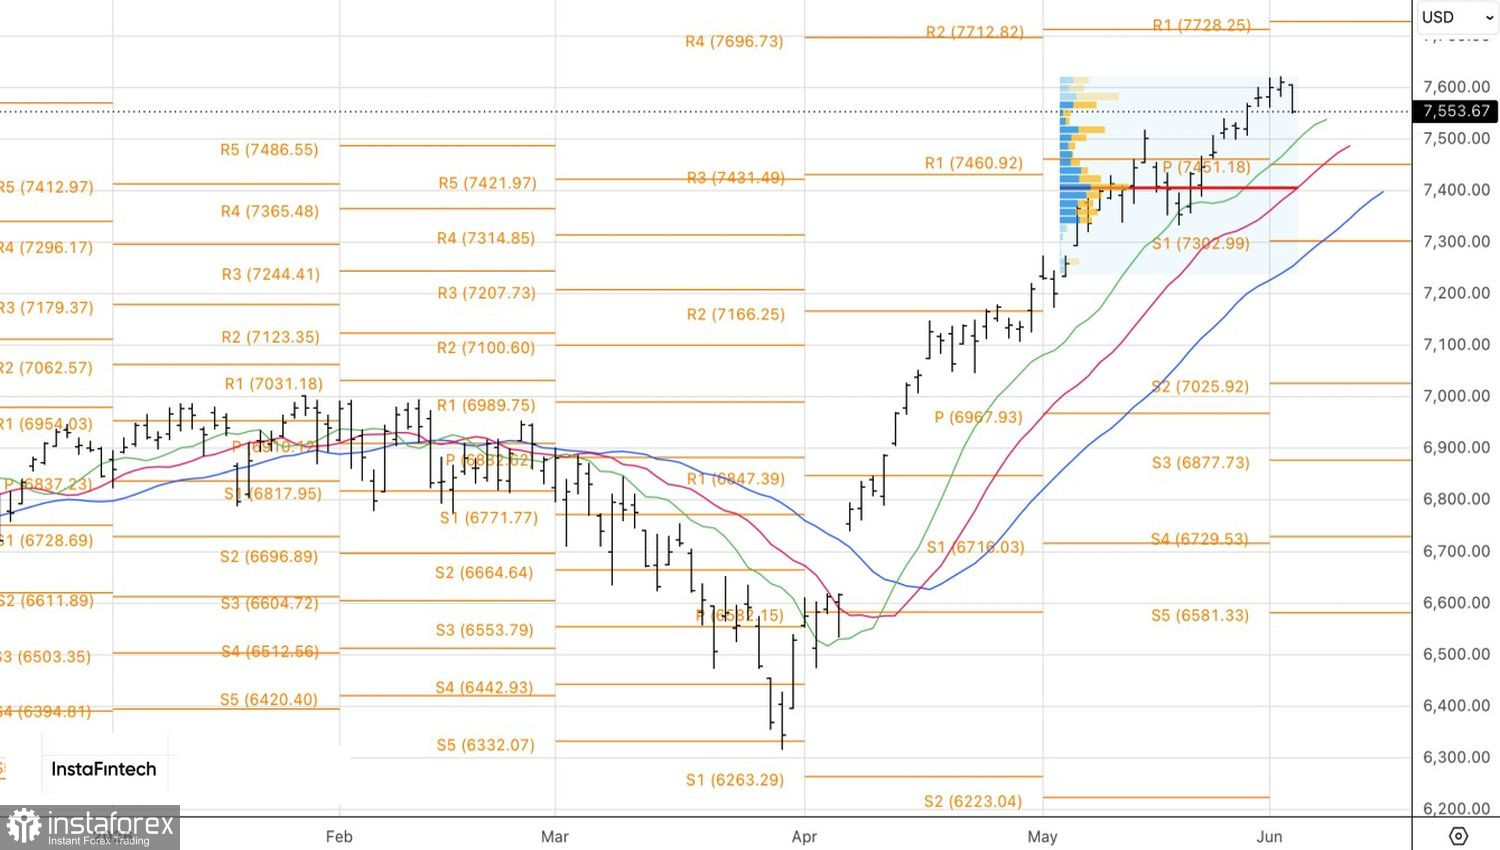
Technically, the daily chart shows that the S&P 500 is pulling back after a prolonged rally. The uptrend remains intact, so bounces off dynamic support levels in the form of moving averages or nearby pivot levels at $7,490 and $7,460 make sense as opportunities to build long positions toward the previously stated upside target of $7,700.
You have already liked this post today
*यहां पर लिखा गया बाजार विश्लेषण आपकी जागरूकता बढ़ाने के लिए किया है, लेकिन व्यापार करने के लिए निर्देश देने के लिए नहीं |

