

Актуальні патерни

Патерни - це графічні моделі, які "малюють" ціни на графіку. Один з постулатів технічного аналізу говорить нам про те, що історія (рух ціни) завжди повторюється. Це означає, що в схожих ситуаціях рух ціни, найчастіше, буде схожим, що дозволяє з високою часткою ймовірності спрогнозувати подальший розвиток ситуації.
Актуальні патерни від ІнстаФорекс - це зручний сервіс, який дозволить вам завжди бути в курсі останніх змін на ринку і вчасно реагувати на підказки, що з'явилися, від ринку. У нашому сервісі ви завжди знайдете найсвіжіші і актуальніші патерни на будь-якій парі і на будь-якому таймфреймі.
Двойное дно
сформирован 22.04 в 03:50:50 (UTC+0)
сила сигнала 1 из 5
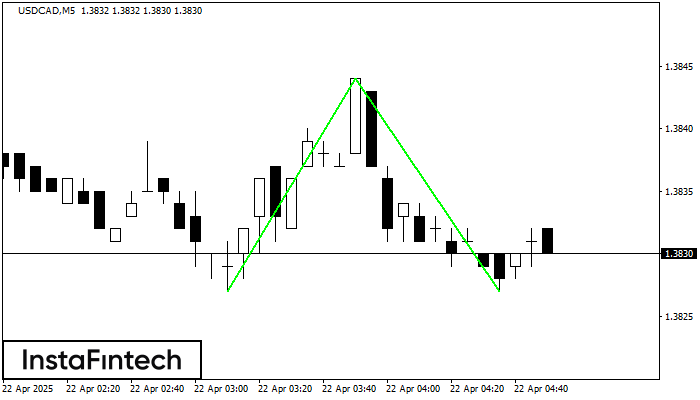
Сформирована фигура «Двойное дно» на графике USDCAD M5. Данное формирование сигнализирует об изменении тенденции с нисходящего на восходящее движение. Сигнал: Торговую позицию на покупку следует открывать после пробоя верхней границы фигуры 1.3844, где перспектива будущего хода будет являться шириной текущей фигуры - 17 пунктов.
Таймфреймы М5 и М15 могут иметь больше ложных точек входа.


