อ่านรายละเอียดเพิ่มเติม
Let's look at how well the British pound sterling has performed when paired with the US dollar since the market ended trading for the first month of summer yesterday, as you are probably aware. But first, a little background on the oldest period. Naturally, trading every month is impossible due to the enormous price fluctuations and the challenging nature of identifying the best entry and exit moments. However, it is important to consider the candle that appears, its closing price, and the maximum and lowest values following each close of monthly trading. All those mentioned above can assist in understanding the course's future path at the beginning of the month.
Monthly
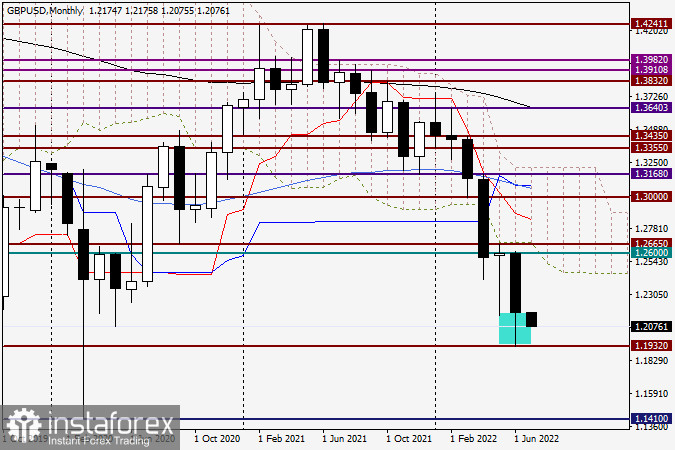
Last month, the pound experienced intense selling pressure and dropped as far as 1.2000. The GBP/USD pair did, however, manage to find solid support at 1.1932, after which it entered the correction phase. As a result, the June auction ended at the price of 1.2174, and the candle's lower shadow was rather remarkable. If you look at the history, and the monthly chart is ideal for this, you can see that the pair has frequently established strong support at about 1.2000, following which it has sprinted in the direction of the north. The same thing occurred in 2020, 2019, and 2017. Although the pair fell as low as 1.1410 in 2020, it was able to significantly cut losses by closing the March candle of this year at 1.2412.
I want to reiterate that the pound is one of the most volatile currencies and has the potential to experience the greatest falls and the highest ups. The primary interest rate has been raised by the Bank of England numerous times, but the pound has not benefited from these increases. The market's complete disregard for the British Central Bank's hike in the primary interest rate is astonishing. However, nothing in the market is unexpected or impossibly difficult. You should constantly be ready for everything and not pass out when making some extremely powerful motions. The ending of July at 1.2000, and much more so below 1.1932, will significantly help players decrease the rate, according to the technical picture on the most senior timeframe. Only after a genuine breakdown of the resistance levels of 1.2600 and 1.2665 is an upward scenario viable.
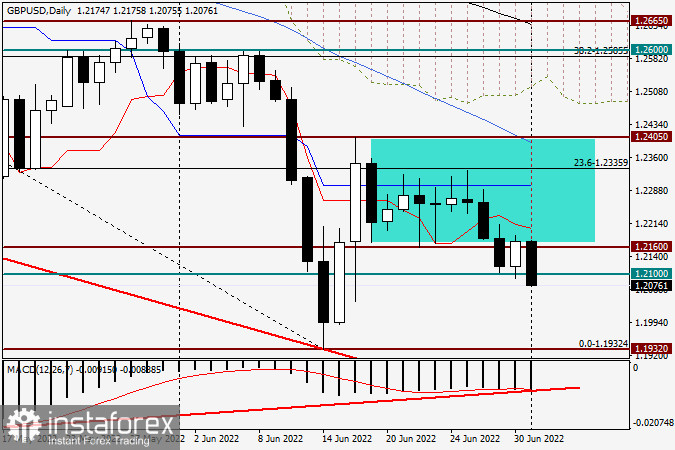
Daily
The pound/dollar currency pair rose throughout yesterday's trade, and the start of the higher dynamics was close to another significant and crucial technical mark of 1.2100. Today, when this piece is being finished, the opposite image is visible; the pair is trading lower and is once more attempting to move below the level of 1.2100. Despite the MACD indicator's positive divergence, it is not advantageous for players to drive up the exchange rate. The "Briton" cannot raise his head because of the potential negative consequences. But it might occur at any time. I won't disguise the fact that I anticipate that the pound will still be able to change the direction of trade in a pair with the US dollar in its favor despite the already significant decrease and the daily bullish divergence of the MACD indicator. However, I'm not recommending making any purchases; instead, you should wait for strong indications and do it weekly. It's not the most enjoyable activity to sell on the approach to the historical, technical, and psychological level of 1.2000. Therefore, I advise keeping away from the GBP/USD market for the time being.
You have already liked this post today
*บทวิเคราะห์ในตลาดที่มีการโพสต์ตรงนี้ เพียงเพื่อทำให้คุณทราบถึงข้อมูล ไม่ได้เป็นการเจาะจงถึงขั้นตอนให้คุณทำการซื้อขายตาม
การฝ่าทะลุในวันนี้เหนือเส้นค่าเฉลี่ยเคลื่อนที่ 50 วัน (SMA) รวมถึงการเคลื่อนไหวที่สูงกว่าระดับต้านทานแนวนอนที่ 147.50 และระดับจิตวิทยาที่ 148.00 ถือเป็นข้อได้เปรียบสำหรับกลุ่มกระทิง (Bulls) นอกจากนี้ ออสซิลเลเตอร์ในกราฟรายวันเพิ่งเริ่มได้รับโมเมนตัมเชิงบวก ยืนยันถึงศักยภาพในการเติบโตต่อเนื่อง แต่อย่างไรก็ตาม ความก้าวหน้ายังพบการต้านทานที่ระดับจิตวิทยาที่
คู่สกุลเงินนี้กำลังเผชิญกับแรงกดดันไม่ใช่จากปัจจัยพื้นฐานแต่จากปัจจัยเชิงเทคนิค หลังจากที่ Fed ตัดสินใจลดอัตราดอกเบี้ยหลัก 0.25% ในการประชุม ตลาดก็เริ่มทำกำไรจากการขายดอลลาร์ก่อนหน้านี้ รวมถึงการขายในคู่เงินยูโรด้วย แนวโน้มนี้อาจยังคงดำเนินต่อไปในท้องถิ่น เนื่องจากปัญหาเศรษฐกิจเชิงลบของยุโรป รวมถึงการมีส่วนร่วมของสหรัฐในสงครามยูเครน ในมุมมองทางเทคนิค คู่สกุลเงินนี้มีการซื้อขายต่ำกว่าระดับแนวต้านที่ 1.1775 ซึ่งอาจคงอยู่
ในกราฟรายชั่วโมง คู่เงิน GBP/USD ในวันพฤหัสบดีได้สร้างฐานต่ำกว่าบริเวณแนวรับที่ 1.3587–1.3611 ซึ่งอาจเป็นการยืนยันการลดลงต่อของเงินปอนด์ไปสู่ระดับการกลับตัว 76.4% ที่ 1.3482 ถ้าหากดีดตัวกลับจาก 1.3482 แล้วเกิดการเติบโตขึ้นอีก จะทำให้แนวโน้มยังคงเป็น "bullish" อย่างไรก็ตาม
การวิเคราะห์แนวโน้ม (รูปที่ 1) ในวันศุกร์ ตลาดจากระดับ 1.3551 (ราคาปิดของแท่งเทียนรายวันเมื่อวานนี้) อาจมีการเคลื่อนไหวลงต่อไปสู่เป้าหมายที่ 1.3482 ระดับการย้อนกลับ 61.8% (เส้นประสีแดง) เมื่อมีการทดสอบระดับนี้ อาจมีการเคลื่อนไหวแก้ไขขึ้นไปสู่เป้าหมายที่ 1.3501
เมื่อวันพฤหัสบดี คู่เงินนี้ได้เคลื่อนตัวลง โดยเส้น EMA 13 ช่วงเวลา – 1.1748 (เส้นบางสีเหลือง) – ได้เคลื่อนตัวขึ้น ปิดเทียนรายวันที่ 1.1788 วันนี้คู่เงินนี้อาจจะยังคงเคลื่อนตัวลง ยังไม่มีข่าวสำคัญตามปฏิทินเศรษฐกิจที่คาดการณ์ไว้
ค่าเงินยูโรได้ค่อย ๆ ถอยหลังออกจากระดับสูงสุดเมื่อวันที่ 17 กันยายน โดยทั่วไปแล้ว หลังจากการประชุมของธนาคารกลางสิ้นสุดลงและไม่มีแนวโน้มใหม่เกิดขึ้น นักลงทุนจะเปลี่ยนความสนใจไปยังความสมดุลของตัวชี้วัดทางเศรษฐกิจ ซึ่งเป็นตัวชี้นำของนโยบายการเงิน บางครั้งอาจดูเหมือนว่ายอดขายสินค้าปลีกหรือการอนุญาตก่อสร้างไม่สามารถเคลื่อนอัตราแลกเปลี่ยนให้ขึ้นหรือลง 1% ได้ แต่ประกาศเหล่านี้มีพลังในการเคลื่อนทิศทางระยะยาวที่สามารถสนับสนุนแนวโน้มไปได้หลายเดือนข้างหน้า การไม่มีการตอบสนองในตลาดทันทีต่อการเปลี่ยนอัตราดอกเบี้ยของ
ธนาคารแห่งประเทศอังกฤษได้จัดการประชุมเมื่อวานนี้ ซึ่งตรงตามความคาดหมายเกือบทั้งหมด ยกเว้นในส่วนของการลงคะแนน: โดยคาดการณ์ไว้ว่าจะมีเสียง 8-1 ในการคงอัตราดอกเบี้ย แต่ผลออกมากลายเป็น 7-2 ขณะนี้ความคาดหวังในการปรับลดอัตราดอกเบี้ยได้เปลี่ยนไปเป็นเดือนพฤศจิกายน ในขณะเดียวกัน ความตระหนักก็แพร่กระจายไปทั่วสื่อและตลาดว่า Fed คงไม่ลดอัตราดอกเบี้ยสองครั้งก่อนสิ้นปี ดังนั้น
คู่สกุลเงิน USD/JPY ใช้เวลาตลอดสัปดาห์ที่ผ่านมาในเกมที่ซับซ้อนและสับสน โดยมีการเคลื่อนไหวที่ผิดพลาดในทั้งสองทิศทาง ล่าสุดเกิดการทะลุหลอกที่ลึกลงใต้ระดับแนวรับที่ 146.29 ด้วยเงาล่างในวันพุธ ตอนนี้ ราคาจะพยายามทำลายและยืนเหนือเส้น MACD ระดับรายวัน (148.28) ถ้าสำเร็จ ราคาจะสามารถขึ้นไปเหนือระดับเป้าหมายแรกที่ 149.38
ราคาทองคำลดลงเป็นวันที่สองติดต่อกันจากระดับสูงสุดเป็นประวัติการณ์ หลังจากความผันผวนที่เกิดขึ้นจากการดำเนินการของ Fed เป็นวันที่สองติดต่อกันที่ราคาทองคำลดลงจากระดับสูงสุดเป็นประวัติการณ์ หลังจากความผันผวนที่เกิดขึ้นโดยการเคลื่อนไหวของ Fed ทองคำได้ลดลงต่ำกว่า $3658 และเส้นค่าเฉลี่ยเคลื่อนที่แบบง่าย (SMA) ระยะเวลา 50 รอบบนกราฟ 4 ชั่วโมง
InstaForex
บัญชี PAMM
Your IP address shows that you are currently located in the USA. If you are a resident of the United States, you are prohibited from using the services of InstaFintech Group including online trading, online transfers, deposit/withdrawal of funds, etc.
If you think you are seeing this message by mistake and your location is not the US, kindly proceed to the website. Otherwise, you must leave the website in order to comply with government restrictions.
Why does your IP address show your location as the USA?
Please confirm whether you are a US resident or not by clicking the relevant button below. If you choose the wrong option, being a US resident, you will not be able to open an account with InstaTrade anyway.
We are sorry for any inconvenience caused by this message.