Bearish Rectangle
was formed on 30.04 at 16:31:32 (UTC+0)
signal strength 3 of 5
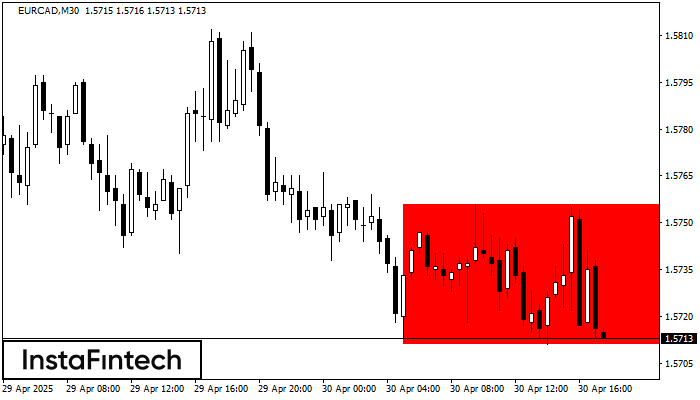
According to the chart of M30, EURCAD formed the Bearish Rectangle which is a pattern of a trend continuation. The pattern is contained within the following borders: lower border 1.5711 – 1.5711 and upper border 1.5756 – 1.5756. In case the lower border is broken, the instrument is likely to follow the downward trend.
- All
- All
- Bearish Rectangle
- Bearish Symmetrical Triangle
- Bullish Rectangle
- Double Top
- Double Top
- Triple Bottom
- Triple Bottom
- Triple Top
- Triple Top
- All
- All
- Buy
- Sale
- All
- 1
- 2
- 3
- 4
- 5
Doble Piso
was formed on 08.07 at 20:00:35 (UTC+0)
signal strength 2 of 5
El patrón Doble Piso ha sido formado en #NTDOY M15. Características: el nivel de soporte 22.14; el nivel de resistencia 22.25; el ancho del patrón 11 puntos. Si el nivel
Los marcos de tiempo M5 y M15 pueden tener más puntos de entrada falsos.
Open chart in a new window
Doble Piso
was formed on 08.07 at 20:00:35 (UTC+0)
signal strength 3 of 5
El patrón Doble Piso ha sido formado en #NTDOY M30. Características: el nivel de soporte 22.14; el nivel de resistencia 22.25; el ancho del patrón 11 puntos. Si el nivel
Open chart in a new window
Doble Piso
was formed on 08.07 at 20:00:32 (UTC+0)
signal strength 3 of 5
El patrón Doble Piso ha sido formado en #NTDOY M30. Características: el nivel de soporte 22.14; el nivel de resistencia 22.25; el ancho del patrón 11 puntos. Si el nivel
Open chart in a new window