Bearish Rectangle
was formed on 29.04 at 08:57:20 (UTC+0)
signal strength 2 of 5
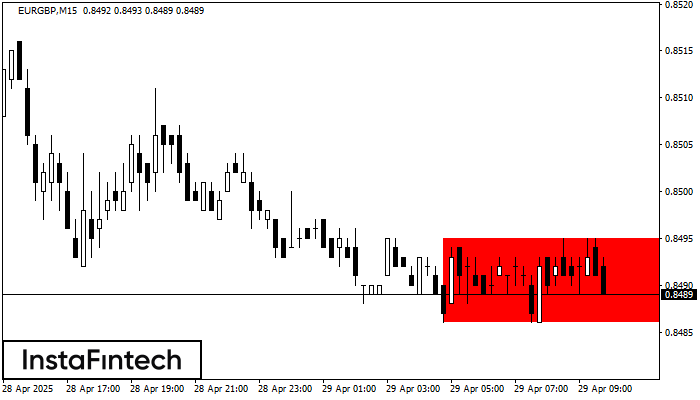
According to the chart of M15, EURGBP formed the Bearish Rectangle which is a pattern of a trend continuation. The pattern is contained within the following borders: lower border 0.8486 – 0.8486 and upper border 0.8495 – 0.8495. In case the lower border is broken, the instrument is likely to follow the downward trend.
The M5 and M15 time frames may have more false entry points.
Vea asimismo
- All
- All
- Bearish Rectangle
- Bearish Symmetrical Triangle
- Bullish Rectangle
- Double Top
- Double Top
- Triple Bottom
- Triple Bottom
- Triple Top
- Triple Top
- All
- All
- Buy
- Sale
- All
- 1
- 2
- 3
- 4
- 5
Rectángulo Alcista
was formed on 29.07 at 19:12:40 (UTC+0)
signal strength 1 of 5
Según el gráfico de M5, GBPUSD formó el Rectángulo Alcista. Este tipo de patrón indica la continuación de una tendencia. Esto consiste de dos niveles: resistencia 1.3346 y soporte 1.3336
Los marcos de tiempo M5 y M15 pueden tener más puntos de entrada falsos.
Open chart in a new window
Doble Techo
was formed on 29.07 at 19:00:38 (UTC+0)
signal strength 1 of 5
El patrón Doble Techo ha sido formado en GBPUSD M5. Esto señala que la tendencia ha sido cambiada de alcista a bajista. Probablemente, si la base del patrón 1.3337
Los marcos de tiempo M5 y M15 pueden tener más puntos de entrada falsos.
Open chart in a new window
Doble Techo
was formed on 29.07 at 18:46:50 (UTC+0)
signal strength 2 of 5
El patrón Doble Techo ha sido formado en GBPCHF M15. Esto señala que la tendencia ha sido cambiada de alcista a bajista. Probablemente, si la base del patrón 1.0727
Los marcos de tiempo M5 y M15 pueden tener más puntos de entrada falsos.
Open chart in a new window