
Vea también


 24.08.2026 04:19 AM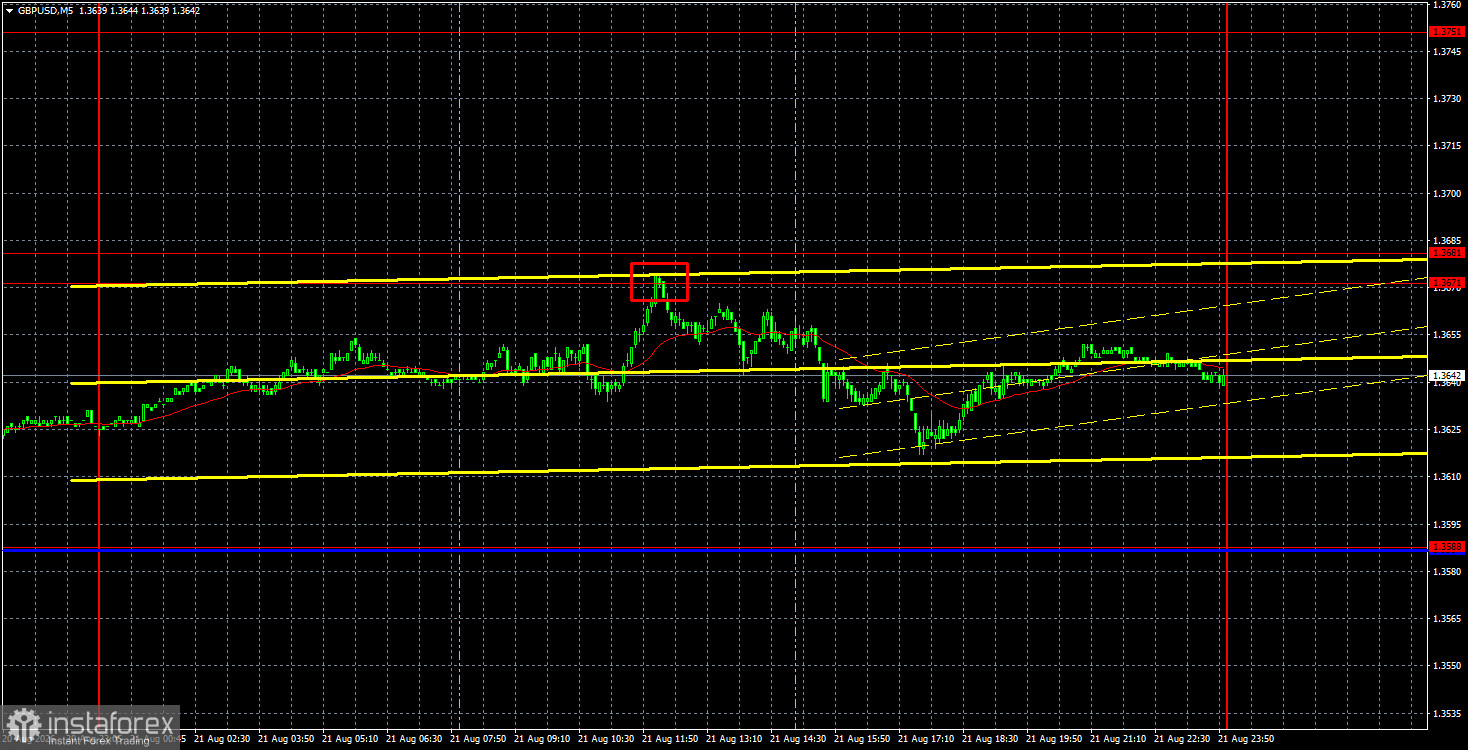
The GBP/USD currency pair began a downward correction on Friday after it failed to overcome the area between 1.3671 and 1.3681. Therefore, the price could soon drop to a critical level. In our opinion, Monday is a suitable day for this, as no important events or publications are scheduled for Monday. On Friday, the British pound had the chance to continue higher after quite positive business activity indices for the UK's services and manufacturing sectors were released in the morning. The services sector index stood at 52.8, above expectations, while the manufacturing sector index was at 51.5, in line with forecasts. A retail sales report was also published, showing a negative result for July, although it generally met expectations. Since only one of the three reports was positive, support for the pound sterling was limited. In the afternoon, U.S. data showed mixed results, with the manufacturing sector's business activity index falling below market expectations. As a result, the dollar showed slight growth at the end of the week.
From a technical standpoint, the British pound continues to form an upward trend on the hourly timeframe, as indicated by the trend line. In the long term, the pair is in a sideways channel and has the potential to resume the global upward trend of 2022. Thus, the pound could easily rise another 100 pips. The direction of future movements will depend on whether the market is ready to resume the global four-year trend. We believe it is.
In the 5-minute timeframe, a sell signal formed on Friday and may develop on Monday. The price bounced from the 1.3671-1.3681 area, allowing traders to open short positions. If the trade was closed before the market closed for the weekend, the profit was around 15 pips.
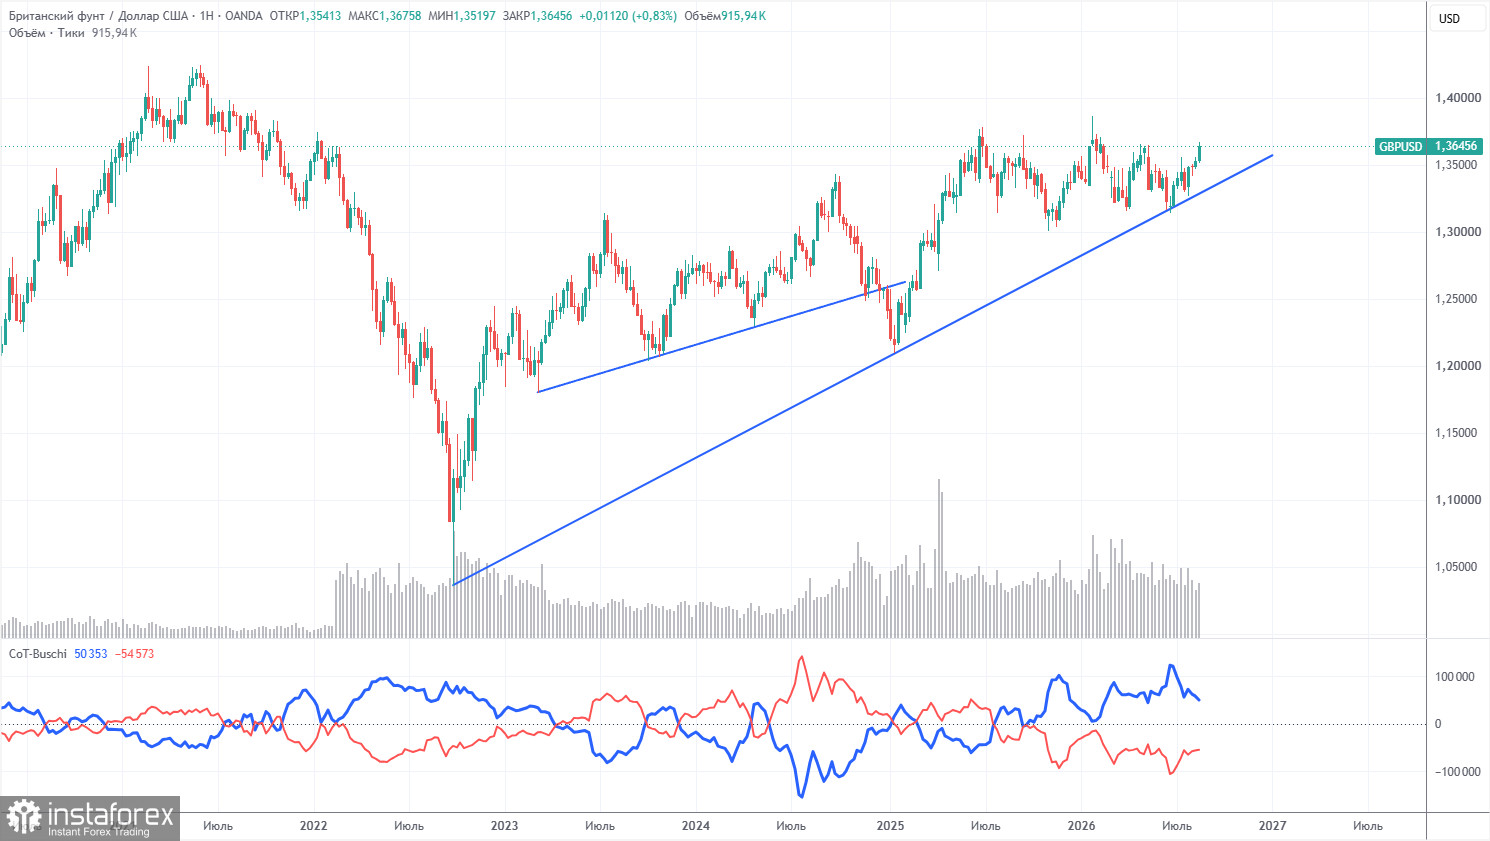
The COT reports for the British pound indicate that for several months now, non-commercial traders have dominated the market with sell positions. The net position remains negative despite the long-term upward trend. Given events in the Middle East, it is not surprising that demand for the dollar was quite high in the first half of 2026. The war is formally over, but the conflict persists. Only geopolitics can support the U.S. dollar in the near future. However, until the price settles below the trend line, we would not expect a strong decline in the pair.
In the long term, the dollar will continue to decline due to Donald Trump's policy, which is clearly visible on the weekly timeframe. The trade war will continue in one form or another for a long time, and Trump's policies are aimed directly and indirectly at weakening the American currency. The long-term upward trend remains, as evidenced by the trend line. The price has recently interacted with this line and has bounced off it. According to the latest COT report (dated August 18), the "Non-commercial" group opened 12,100 BUY contracts and 10,400 SELL contracts. Thus, the net position of non-commercial traders increased by 1,700 contracts over the week.
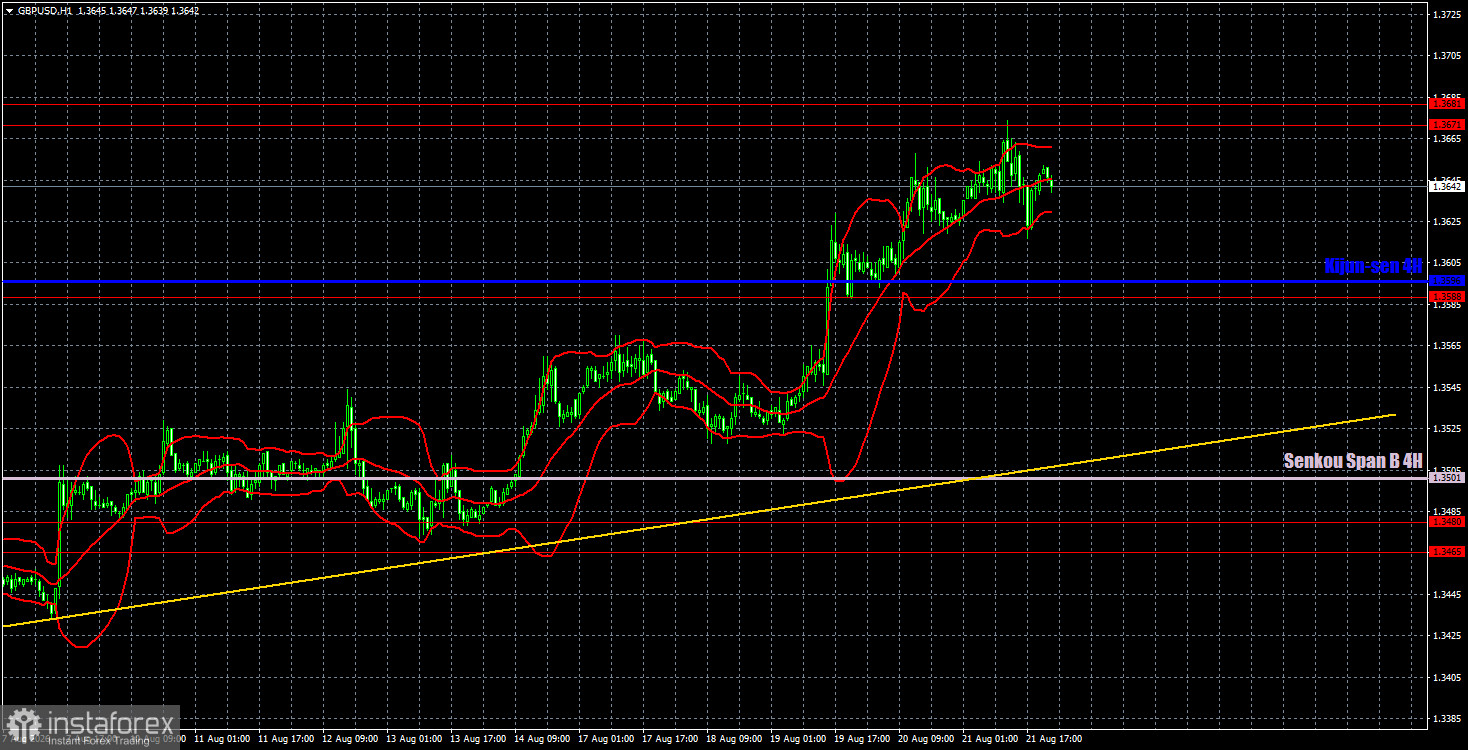
On the hourly timeframe, the GBP/USD pair continues to form an upward trend, as indicated by the trend line and the Ichimoku indicator lines. In the long term, both European currencies still "look" upward. We expect the British pound to continue growing in the coming weeks. The upward trend will be interrupted if the price settles below the trend line.
On August 24, we highlight the following important levels: 1.3042-1.3050, 1.3096-1.3115, 1.3179-1.3187, 1.3301-1.3309, 1.3369-1.3377, 1.3465-1.3480, 1.3588, 1.3671-1.3681. The Senkou Span B (1.3501) and Kijun-sen (1.3596) lines may also serve as signal sources. It is recommended to set the stop-loss order to break even when the price moves in the right direction by 20 pips. The lines of the Ichimoku indicator may shift throughout the day, which should be taken into account when determining trading signals.
On Monday, there are no significant events or publications scheduled in the UK and the U.S. Therefore, traders will have nothing to react to throughout the day, and volatility may be low again. It seems we are in for a typical "boring Monday."
Today, traders may consider opening short positions with a target of 1.3588 if the price bounces from the 1.3671-1.3681 area. Alternatively, they may maintain short positions based on Friday's signal. Long positions can be opened if there is a bounce from the 1.3588-1.3596 range, with a target towards 1.3671-1.3681.


