Vea también

 12.06.2026 07:15 PM
The wave pattern on the 4-hour chart for EUR/USD has changed. There is still no reason to speak of the cancellation of the upward trend segment (lower chart), which began in January of last year. However, the wave structure has now taken on a corrective form. In the long term, a wave C formation can be expected, with its low positioned below the low of wave A. At present, it is difficult to believe in such a significant decline of the euro, but the first quarter of 2026 demonstrated that geopolitics can work wonders and reverse established trends.
On the lower time frame, I can identify a classic five-wave bearish structure. After this structure is completed, the instrument may transition to an upward wave sequence, and at the moment the structure appears complete. Therefore, a rise in the European currency can be expected from the 1.1513 level, which corresponds to the 76.4% Fibonacci retracement level. However, without geopolitical support, the euro cannot count on favorable market sentiment.
The EUR/USD pair was virtually unchanged on Friday, though it gained approximately 40 basis points the day before. Forty points is not much, but yesterday market participants were clearly preparing for renewed EUR/USD selling. Most likely, we would have seen that scenario if Donald Trump had not announced in the evening that the planned strikes against Iran on Friday had been canceled and that a deal with Iran could be signed as early as this weekend. As in many previous cases, the "inside information" was reported by Axios. Previously, I wondered whether anyone in the market still believed Donald Trump. Now I wonder whether anyone still believes Axios.
Essentially, in recent weeks Axios has become a super-insider that appears to be the only source in the world that knows what is really happening in the Middle East, how negotiations between Iran and the United States are progressing, and when a deal will be reached. It is worth noting that very little of the information reported by Axios in recent weeks has been confirmed by subsequent developments. Meanwhile, Tehran stated only this morning that it was unaware of any deal that was supposedly "90% complete"—the same claim that had been circulating two weeks earlier. One cannot help but ask: is Trump actually negotiating with the Iranian government?
Nevertheless, the market once again believed in the deal, believed Trump, and believed the insider reports published by Axios, because there is simply no other explanation for the dollar's decline on Thursday evening. The market paid no attention to the ECB's interest-rate hike—the first in three years—or to Christine Lagarde's fairly hawkish rhetoric. Yet as soon as Trump announced for the twenty-fifth time that a deal could be reached over the weekend, traders immediately rushed to sell the dollar. The current wave structure supports further appreciation of the euro, but I believe my readers understand that the situation could change another ten times over the weekend. A house cannot be built on such a weak and unstable foundation, and the euro is unlikely to advance far on that basis alone.
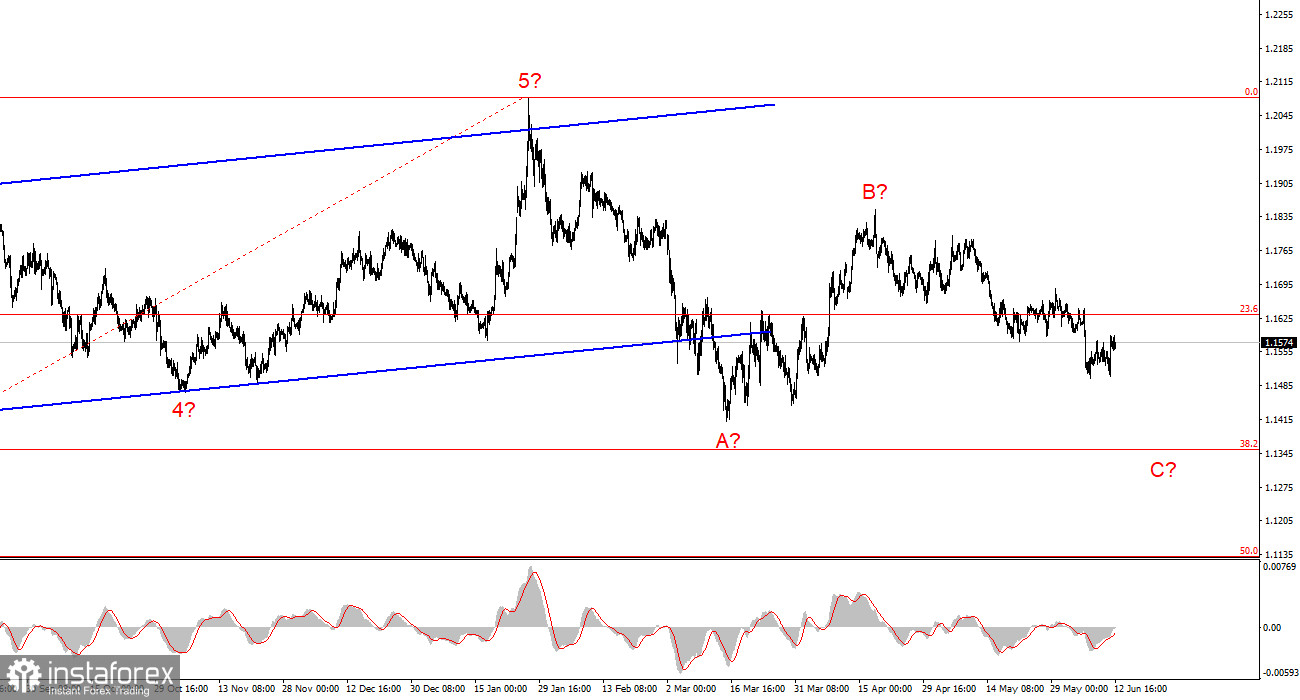
Based on my EUR/USD analysis, I conclude that the instrument remains within an upward trend segment (lower chart), while in the shorter term it remains within a downward trend segment that may already be complete. In my opinion, this is a reasonably good time to consider opening long positions. The failed attempt to break below 1.1513, which corresponds to the 76.4% Fibonacci level, together with the apparently completed bearish trend segment, suggests that the instrument may transition into a new upward wave sequence with targets near the 1.1700 area and higher.
On the higher time frame, an upward trend segment is visible, followed by the formation of a corrective wave structure. In the near future, wave C is expected to develop with targets near 1.1352, which corresponds to the 38.2% Fibonacci retracement level. Once the A-B-C structure is complete, a new long-term bullish trend may begin.
The Basic Principles of My Analysis:


