Vea también

 07.04.2026 12:47 PM
Trade Analysis and Tips for Trading the Japanese Yen
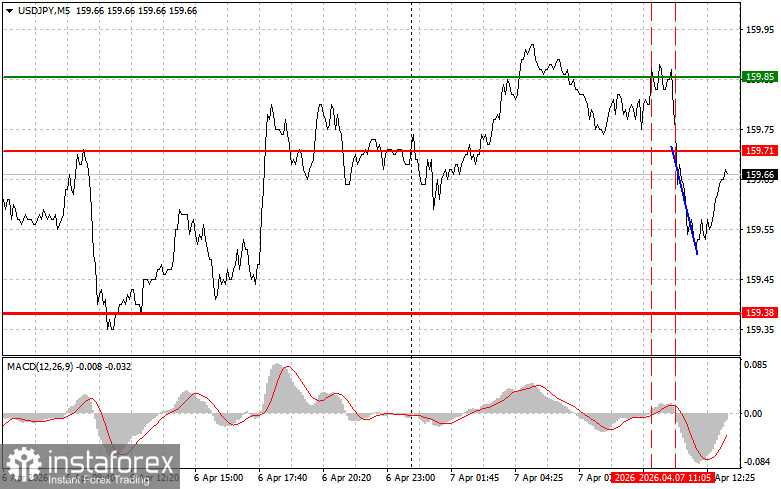
The test of the 159.71 level occurred when the MACD indicator had just begun moving downward from the zero line, confirming a valid entry point for selling the dollar. As a result, the pair declined by more than 20 points.
In the second half of the day, financial markets will be influenced by both international events and economic data. Traders will be closely watching for new statements from US President Donald Trump regarding his stance on the confrontation with Iran. His remarks could trigger sharp volatility, as market participants closely monitor developments in the Middle East, assessing their potential impact on the global economy and commodity prices.
In addition to geopolitical tensions, markets will focus on upcoming US economic data. In particular, this includes the weekly ADP employment report, which serves as a leading indicator of labor market conditions. Data on changes in durable goods orders will also be released, reflecting investment activity and the state of industrial production. Additionally, investor sentiment may be influenced by remarks from Federal Reserve Open Market Committee member Austan D. Goolsbee. Amid uncertainty regarding the future course of Fed monetary policy, his comments on inflation, economic growth, and interest rates will be closely analyzed for clues about the central bank's next steps.
As for the intraday strategy, I will mainly rely on the implementation of Scenarios No. 1 and No. 2.
Buy Signal
Scenario No. 1: I plan to buy USD/JPY today upon reaching the entry point around 159.75 (green line on the chart), with a target of 160.20 (thicker green line on the chart). Around 160.20, I plan to exit long positions and open short positions in the opposite direction (expecting a move of 30–35 points). Growth in the pair today can be expected if US data comes in strong.Important! Before buying, make sure the MACD indicator is above the zero line and just beginning to rise.
Scenario No. 2: I also plan to buy USD/JPY if there are two consecutive tests of the 159.52 level while the MACD indicator is in the oversold zone. This will limit the pair's downward potential and lead to an upward reversal. Growth toward the opposite levels of 159.75 and 160.20 can be expected.
Sell Signal
Scenario No. 1: I plan to sell USD/JPY after a break below the 159.52 level (red line on the chart), which could lead to a sharp decline. The key target for sellers will be 159.26, where I plan to exit short positions and open long positions in the opposite direction (expecting a 20–25 point move). Pressure on the pair may increase further if weak data is released.Important! Before selling, make sure the MACD indicator is below the zero line and just beginning to decline.
Scenario No. 2: I also plan to sell USD/JPY if there are two consecutive tests of the 159.75 level while the MACD indicator is in the overbought zone. This will limit the pair's upward potential and lead to a downward reversal. A decline toward the opposite levels of 159.52 and 159.26 can be expected.
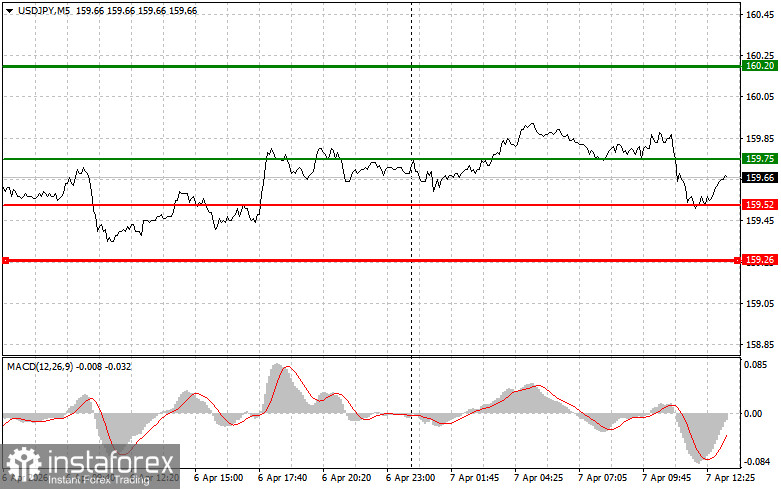
Chart Explanation
Important Note for Beginners
Beginner Forex traders should make entry decisions very carefully. Before major fundamental reports are released, it is best to stay out of the market to avoid sharp price swings. If you choose to trade during news releases, always place stop-loss orders to minimize losses. Without stop-losses, you can quickly lose your entire deposit—especially if you do not use proper money management and trade large volumes.
Remember, successful trading requires a clear trading plan, like the one outlined above. Spontaneous trading decisions based on current market conditions are inherently a losing strategy for intraday traders.


