Vea también

 01.04.2026 07:32 AM
The situation in the cryptocurrency market has remained unchanged for the past month and a half. On the daily timeframe, the sluggish, weak upward correction persists, while on the 4-hour timeframe, it has been 80% flat, with a minimal upward slope. Thus, while a pure flat is absent, there is also no trend, which further complicates the trading process. After Bitcoin left the sideways channel, we considered the flat canceled, as the price's exit above the channel was too strong to be a deviation. However, deviations also vary. The recent movements of "digital gold" show and prove that the flat continues. Last week, the price dropped to the lower boundary of the sideways channel, formed a clear deviation, removed buying liquidity, and is now rising again. It is rising extremely slowly and reluctantly, just as it has been for the last month and a half. Movements within the sideways channel are always random. Thus, the internal patterns of the sideways channel are again insignificant, and the price may soon aim back towards the upper boundary of the channel.
Meanwhile, more and more miners are transitioning to the AI sector, various "crypto experts" continue to sing the praises of an impending "bullish" trend and phenomenal growth, some are pointing out Bitcoin's status as a "safe haven" amid the war in Iran, while Bitcoin itself remains stagnant. The flat is always the calm before the storm, but it's always difficult to say which direction the storm will come from. We still do not see any signs of an end to the downward trend.
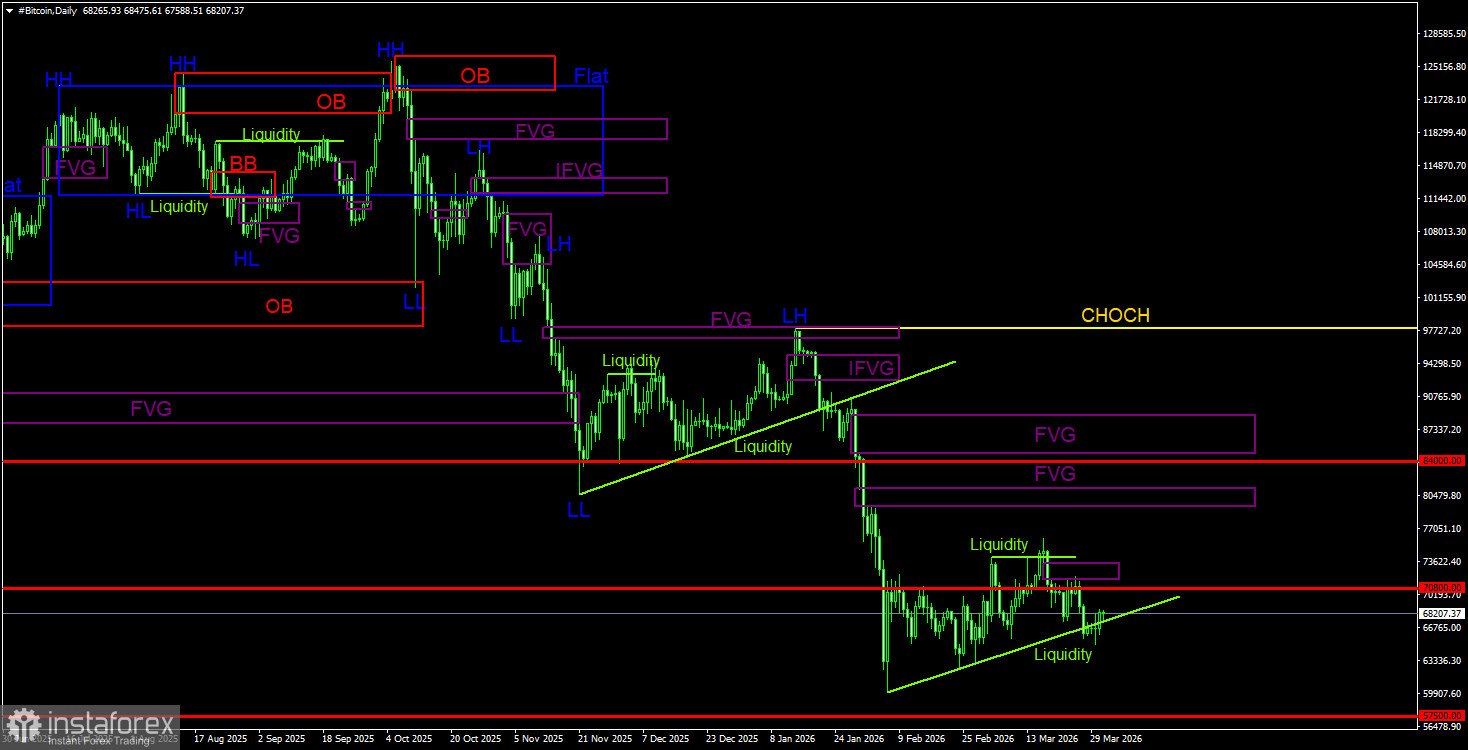
On the daily timeframe, Bitcoin continues to form a downward trend. The trend structure is identified as downward, and the CHOCH line remains at the level of $97,900. Only above this level can it be considered that the downward trend is over. The last sell signal was formed within a "bearish" FVG ($96,900 – $98,000). Thus, traders had an excellent opportunity to capture almost the entire last downward movement. Now it remains only to wait. With no signs of a trend shift to the upside, we believe that the decline will continue. On the daily timeframe, the nearest area of POI for new sell trades is in the range of $79,500 – $81,100. Additionally, another "bearish" FVG formed about a week ago (with an initial removal of sell liquidity), and the price reacted to it. However, on the 4-hour timeframe, there is still a high probability of a flat.
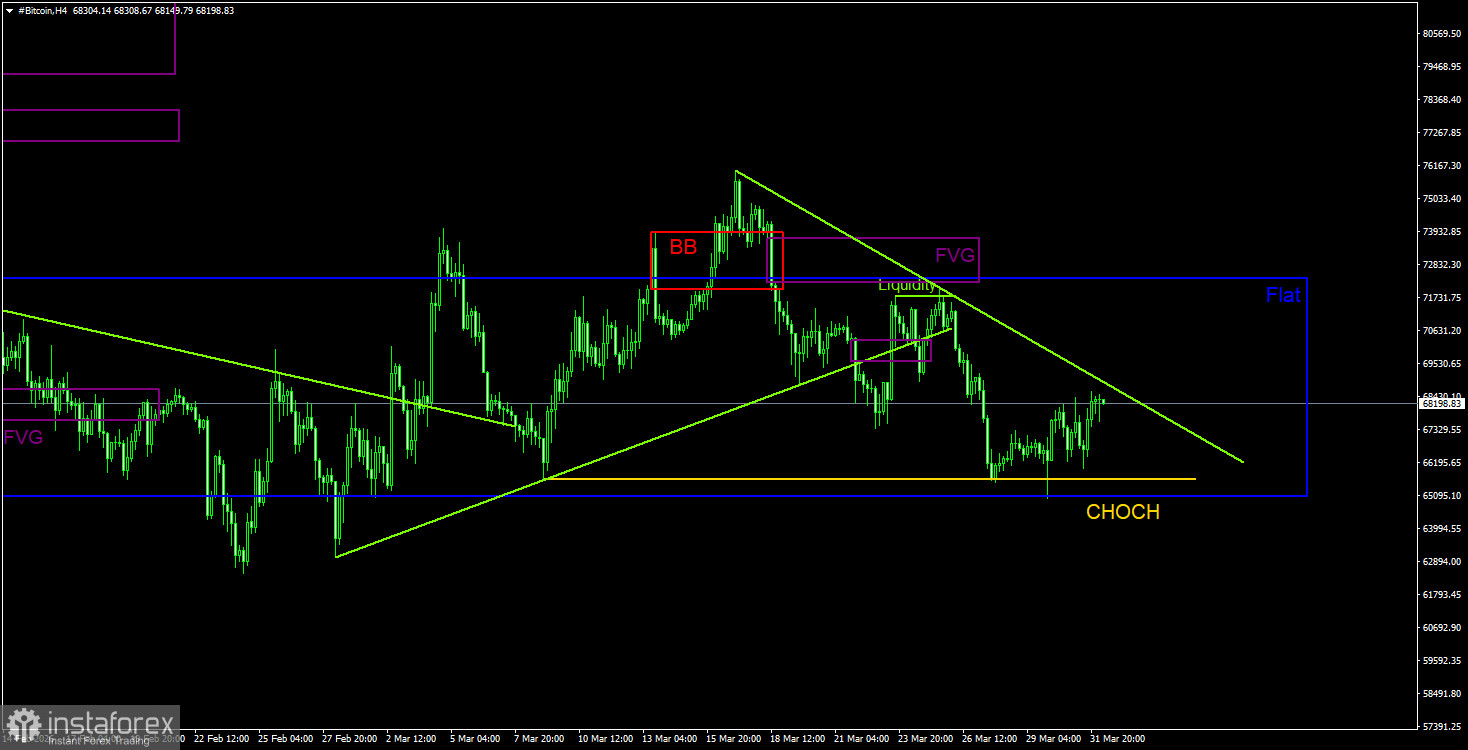
On the 4-hour timeframe, the price has dropped to the lower boundary of the sideways channel, formed a deviation/rebound from it, and can now rise again. The CHOCH line, which provides support for the upward correction, is at $65,500 and has not been breached. This means the correction continues. Breaching this line would indicate the completion of the correction that has lasted for a month and a half. During the last leg of the decline, two new "bearish" FVGs were formed, but if the flat persists, the internal patterns are of no significance.
Bitcoin continues to form a full downward trend. We still expect a decline targeting $57,500 (the 61.8% Fibonacci level from a three-year upward trend), and there are currently no signs of a trend reversal. However, even the $57,500 level does not now appear to be the final stop. Among the POI areas currently, only the nearest "bearish" FVG on the daily timeframe can be noted. On the 4-hour timeframe, the nature of Bitcoin's movement once again shows all the signs of a flat, so we should only track the deviations of the boundaries of the sideways channel.


