Vea también

 19.01.2026 10:39 AM
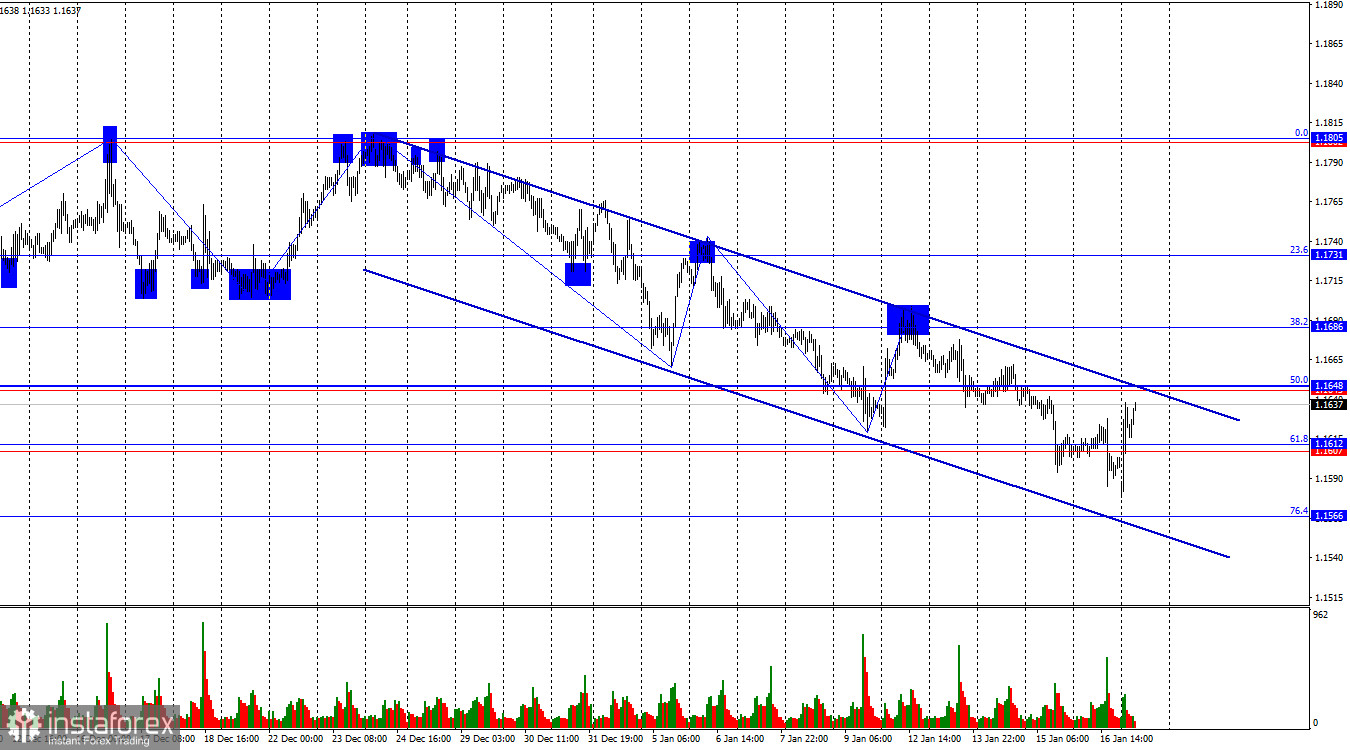
The wave situation on the hourly chart remains simple. The last completed upward wave failed to break the previous peak, while the most recent downward wave broke the previous low. Thus, the trend remains bearish. In my view, the decline of the pair will not be long-lasting or strong, but a break of the current bearish trend is now required in order to expect a bullish advance. Based on the current chart structure, such a break would occur above the 1.1700 level.
On Friday, the EUR/USD pair traded relatively calmly, while the news background was weak. The US industrial production report provided additional support to the US dollar, but overall the market is now focused on completely different, more global geopolitical issues rather than routine economic reports. Overnight, it became known that Donald Trump is introducing new trade tariffs. This time, Germany, Denmark, Norway, Sweden, the United Kingdom, France, the Netherlands, and Finland were affected. What justification did the US president come up with this time? Greenland. According to Trump, European Union countries, which indirectly own Greenland, should have been delighted with Washington's proposal to annex the largest island on Earth, effectively allowing America to control it, deploy its military bases there, and use it for purposes that are impossible to predict under Trump. Naturally, there was no euphoria in Europe over this idea, and Trump moved on to his favorite strategy: "impose tariffs if someone disagrees with you." Thus, 2026 is beginning with a new trade war and global economic and geopolitical confrontation.
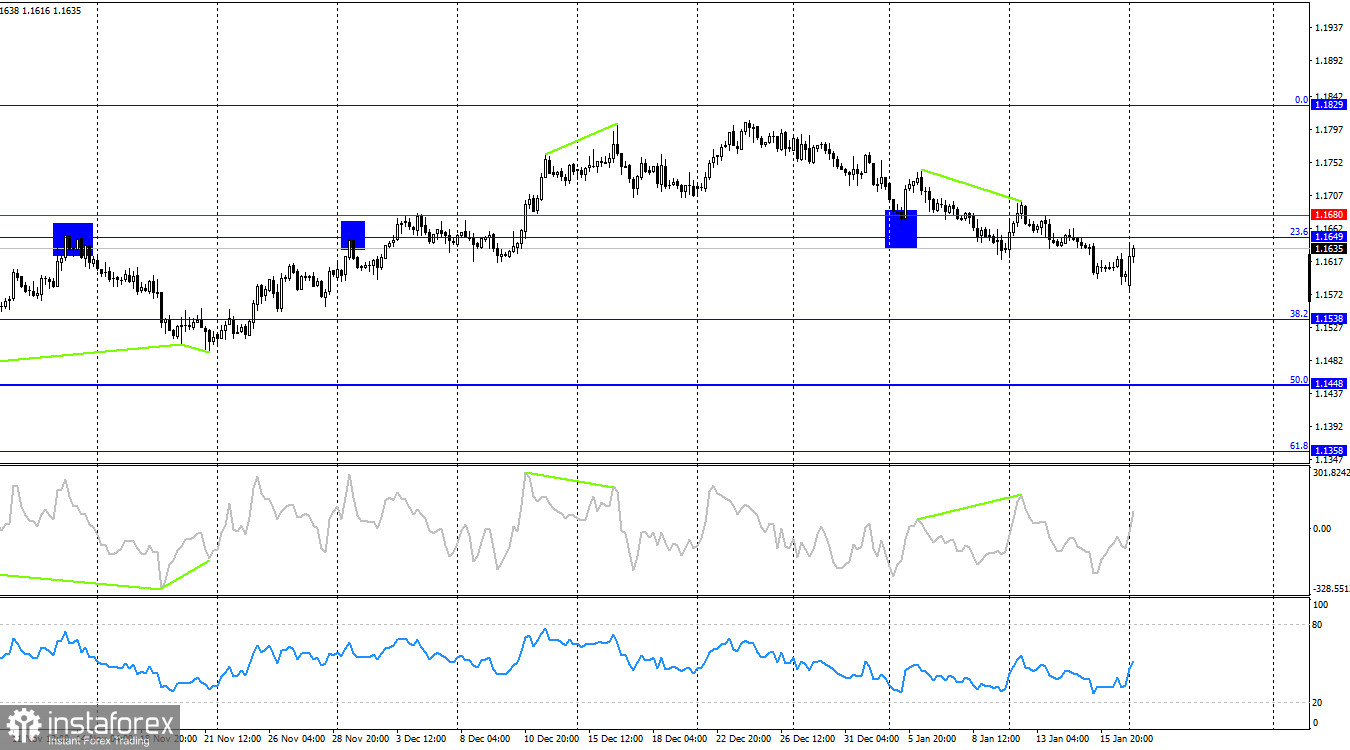
On the 4-hour chart, the pair consolidated below the support level of 1.1649–1.1680, allowing traders to expect a continuation of the decline toward the next 38.2% Fibonacci level at 1.1538. A bearish divergence has formed on the CCI indicator, after which a new decline in the euro began. A close above the 1.1649–1.1680 level would work in favor of the EU currency and a resumption of growth toward the 0.0% corrective level at 1.1829.
Commitments of Traders (COT) Report:
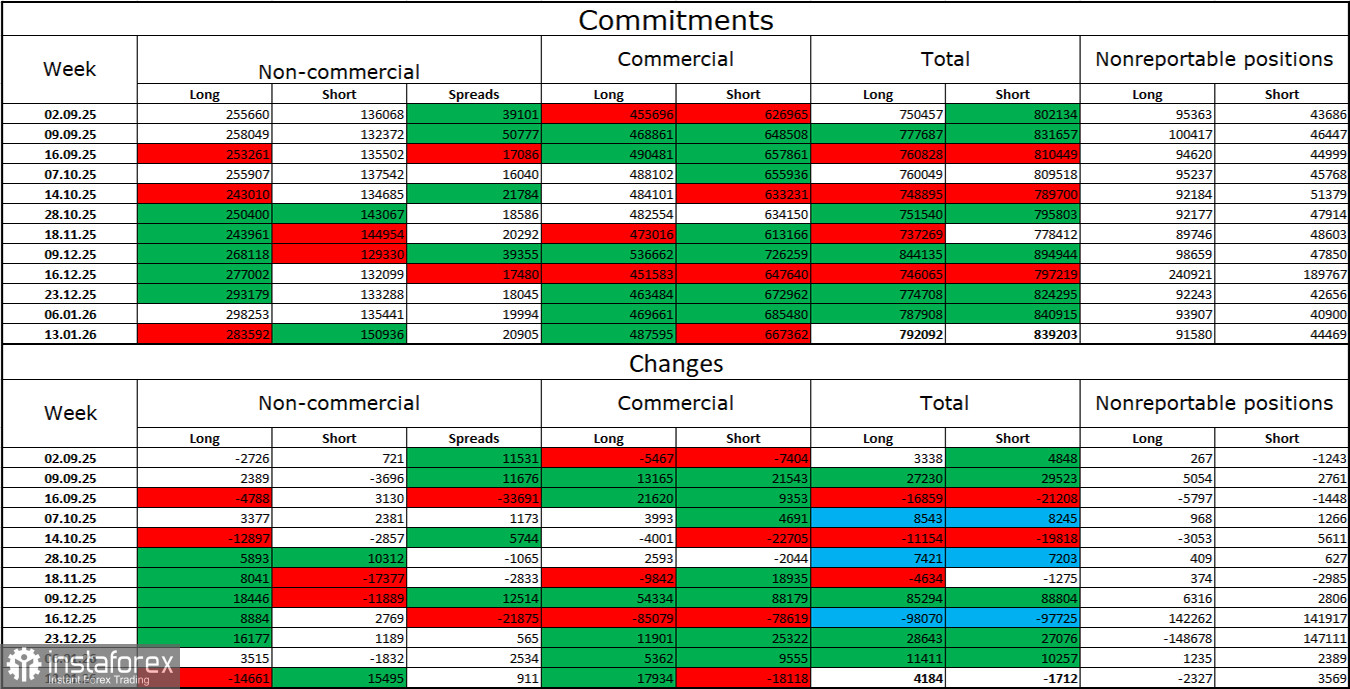
During the latest reporting week, professional players closed 14,661 long positions and opened 15,495 short positions. The sentiment of the non-commercial group remains bullish thanks to Donald Trump and his policies, and it continues to strengthen over time. The total number of long positions held by speculators now stands at 283,000, while short positions amount to 151,000—almost a twofold advantage for bulls.
For thirty-three consecutive weeks, large players were reducing short positions and increasing longs. Then the shutdown began, and now we are seeing the same picture again: professional traders continue to build long positions. Donald Trump's policies remain the most significant factor for traders, as they create numerous problems that will have long-term and structural consequences for the US. One example is the deterioration of the labor market. Traders fear a loss of Federal Reserve independence in 2026 under pressure from Trump and amid the resignation of Jerome Powell.
News Calendar for the US and the European Union:
European Union – Consumer Price Index (10:00 UTC).
On January 19, the economic calendar contains one noteworthy event. The impact of the news background on market sentiment on Monday may be observed in the first half of the day.
EUR/USD Forecast and Trading Advice:
Selling the pair is possible today if there is a rebound from the 1.1645–1.1648 level on the hourly chart, with targets at 1.1612 and 1.1566. Buy positions will become possible after a consolidation above the descending channel and the 1.1645–1.1648 resistance level on the hourly chart, with targets at 1.1686 and 1.1731.
Fibonacci grids are built from 1.1492–1.1805 on the hourly chart and from 1.1066–1.1829 on the 4-hour chart.


