Vea también

 22.02.2024 09:53 AM
Trend analysis (Fig. 1).
The GBP/USD currency pair may rise from the level of 1.2633 (closing of yesterday's daily candle) to 1.2665, the upper limit of the Bollinger Band indicator (red dotted line). Upon reaching this level, the price may decline with a target of 1.2644, the 50% pullback level (blue dotted line).
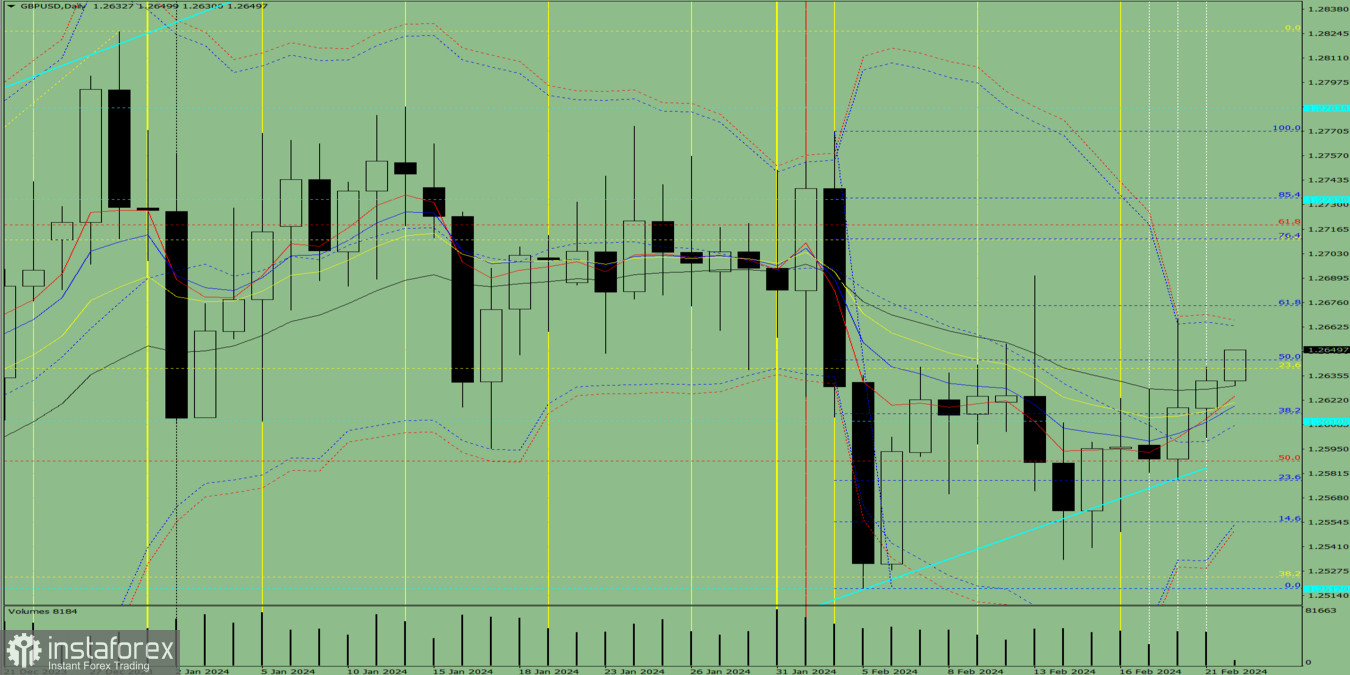
Fig. 1 (daily chart).
Comprehensive analysis:
General conclusion: Today, the price may rise from the level of 1.2633 (closing of yesterday's daily candle) to 1.2665, the upper limit of the Bollinger Band indicator (red dotted line). Upon reaching this level, the price may decline with a target of 1.2644, the 50% pullback level (blue dotted line).
Alternatively, from the level of 1.2633 (closing of yesterday's daily candle), the price may rise with a target of 1.2644, the 50% pullback level (blue dotted line). Upon reaching this level, a downward movement is possible with a target of 1.2621, the 13-day EMA (yellow thin line).
You have already liked this post today
*El análisis de mercado publicado aquí tiene la finalidad de incrementar su conocimiento, más no darle instrucciones para realizar una operación.


