Vea también
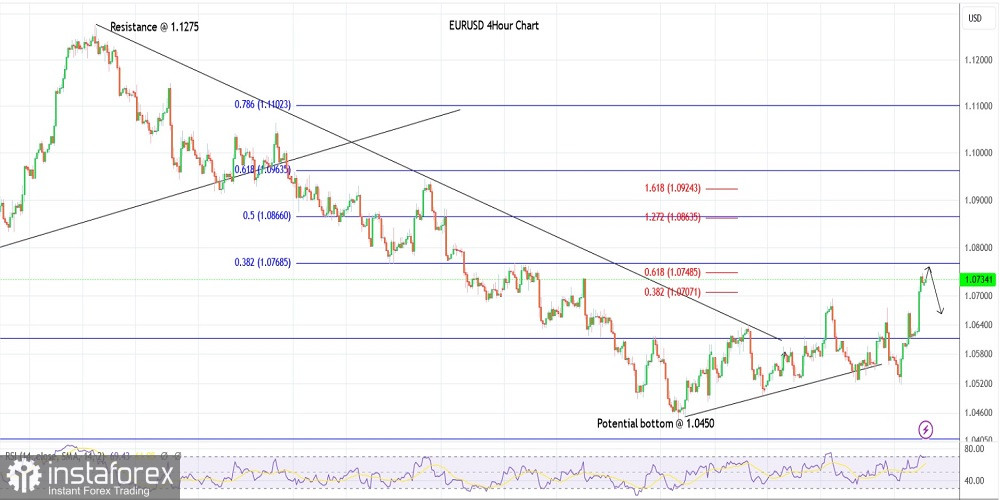
EUR/USD pushed higher towards 1.0750 last Friday, in line with our projections. The single European currency is seen to be trading close to the 1.0735 mark at this point in writing and could be preparing for a pullback soon. It has almost hit the initial Fibonacci extensions. The next projections are towards the 1.0850 and 1.0900 levels respectively.
EUR/USD might drop through the 1.0670-80 zone, which is resistance that has turned into support now, before resuming higher again. The counter trend rally, which had begun from the 1.0450 lows, has hit the Fibonacci 0.382 retracement of the drop between the 1.1275 and 1.0450 levels respectively. Near-term resistance could be faced here before bulls target the 1.0900 mark.
EUR/USD is also seen to be producing a bearish divergence on 4H RSI as seen on the chart here. One more indication that the upside movement could be limited from here and 1.0750 could provide enough resistance for prices to pullback. The next leg higher towards 1.0900-30 could complete the corrective phase, which started at around 1.0450.
Potential drop towards 1.0670-80 is possible before the next wave higher.
Good luck!
You have already liked this post today
*El análisis de mercado publicado aquí tiene la finalidad de incrementar su conocimiento, más no darle instrucciones para realizar una operación.
Ayer se formó solo un punto de entrada al mercado. Veamos el gráfico de 5 minutos y analicemos lo que ocurrió. En mi pronóstico de la mañana, presté atención
Análisis de operaciones del jueves: El par GBP/USD el jueves también se negoció con una volatilidad mínima. Por extraño que parezca, ayer hubo bastantes datos interesantes tanto para la libra
El par EUR/USD el jueves se negoció prácticamente en flat y con una volatilidad muy baja (alrededor de 50 puntos). Después de la tormenta del miércoles por la noche, provocada
Ayer se formaron varios puntos de entrada al mercado. Veamos el gráfico de 5 minutos y analicemos lo que ocurrió. En mi pronóstico matutino presté atención al nivel 1.3376
EUR/USD plan para la sesión europea del 17 de julio. Informes Commitment of Traders COT (análisis de las operaciones de ayer). La presión sobre el jefe
El par de divisas EUR/USD se desplomó bruscamente el martes en medio del informe sobre la inflación estadounidense. Como se suele decir, nada presagiaba el problema. Durante varios días consecutivos
Ayer solo se formó un punto de entrada al mercado. Veamos el gráfico de 5 minutos y analicemos qué ocurrió. En mi pronóstico de la mañana presté atención al nivel
Ayer no llegué a ver condiciones adecuadas para entrar al mercado. Veamos el gráfico de 5 minutos y analicemos lo que ocurrió. En mi pronóstico de la mañana, presté atención
Gráfico Forex
versión web
Your IP address shows that you are currently located in the USA. If you are a resident of the United States, you are prohibited from using the services of InstaFintech Group including online trading, online transfers, deposit/withdrawal of funds, etc.
If you think you are seeing this message by mistake and your location is not the US, kindly proceed to the website. Otherwise, you must leave the website in order to comply with government restrictions.
Why does your IP address show your location as the USA?
Please confirm whether you are a US resident or not by clicking the relevant button below. If you choose the wrong option, being a US resident, you will not be able to open an account with InstaTrade anyway.
We are sorry for any inconvenience caused by this message.