Vea también
The EUR/USD pair has been forming a flat zone for the fifth week in a row. During this time, the price has not gone beyond the extremes formed at the end of November. Now, the task is to look for favorable prices for the sale and purchase of the instrument from the borders of the flat.
These borders can be distinguished by the levels 1.1359 and 1.1234. As long as the closing of daily trading takes place within the specified range, the flat will continue. In order to break the structure, the demand or supply must be allowed to exceed the marks and consolidate above/below the flat zone in one of the active trading sessions.
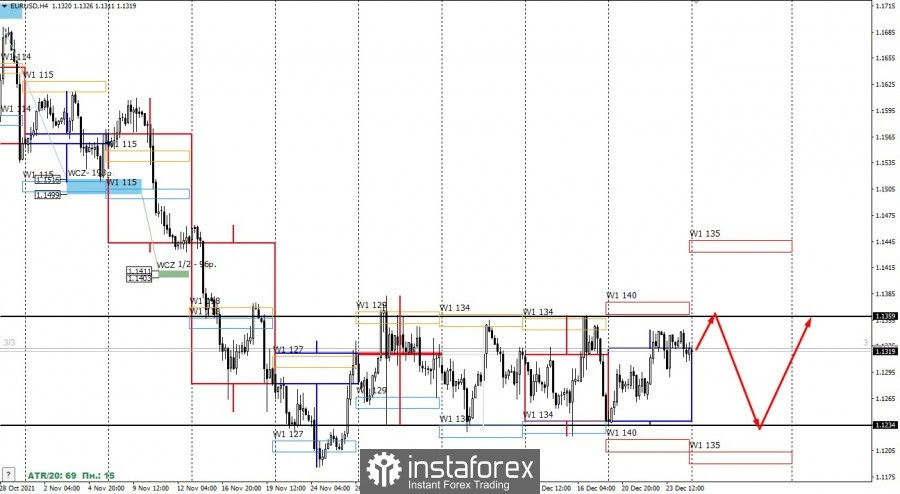
The simplest tactic to cancel a flat is to search for entry points on its borders. It will be profitable at any distance. A stop loss will always mean an exit from a flat. If we consider the decline last November, then the probability of seeing a retest of last month's low is 75%. This must be taken into account when transferring transactions in the medium term.
You have already liked this post today
*El análisis de mercado publicado aquí tiene la finalidad de incrementar su conocimiento, más no darle instrucciones para realizar una operación.
El par de divisas EUR/USD se desplomó bruscamente el martes en medio del informe sobre la inflación estadounidense. Como se suele decir, nada presagiaba el problema. Durante varios días consecutivos
Ayer solo se formó un punto de entrada al mercado. Veamos el gráfico de 5 minutos y analicemos qué ocurrió. En mi pronóstico de la mañana presté atención al nivel
Ayer no llegué a ver condiciones adecuadas para entrar al mercado. Veamos el gráfico de 5 minutos y analicemos lo que ocurrió. En mi pronóstico de la mañana, presté atención
Ayer se formaron varios puntos de entrada al mercado. Veamos el gráfico de 5 minutos y analicemos lo que ocurrió. En mi pronóstico de la mañana presté atención al nivel
Ayer se formó solo un punto de entrada al mercado. Propongo echar un vistazo al gráfico de 5 minutos y analizar lo que ocurrió. En mi pronóstico de la mañana
El pasado viernes solo se formó un punto de entrada al mercado. Veamos el gráfico de 5 minutos y analicemos lo que ocurrió allí. En mi pronóstico de la mañana
Ayer se formaron varios puntos de entrada al mercado. Veamos el gráfico de 5 minutos y analicemos lo que ocurrió. En mi pronóstico de la mañana presté atención al nivel
GBP/USD: plan para la sesión europea del 10 de julio. Informes Commitment of Traders COT (análisis de las operaciones de ayer). La libra tiene dificultades para subir por encima
Ayer se formó solo un punto de entrada al mercado. Veamos el gráfico de 5 minutos y analicemos lo que sucedió allí. En mi pronóstico de la mañana presté atención
Gráfico Forex
versión web
Your IP address shows that you are currently located in the USA. If you are a resident of the United States, you are prohibited from using the services of InstaFintech Group including online trading, online transfers, deposit/withdrawal of funds, etc.
If you think you are seeing this message by mistake and your location is not the US, kindly proceed to the website. Otherwise, you must leave the website in order to comply with government restrictions.
Why does your IP address show your location as the USA?
Please confirm whether you are a US resident or not by clicking the relevant button below. If you choose the wrong option, being a US resident, you will not be able to open an account with InstaTrade anyway.
We are sorry for any inconvenience caused by this message.