
Veja também


 27.05.2026 04:30 AM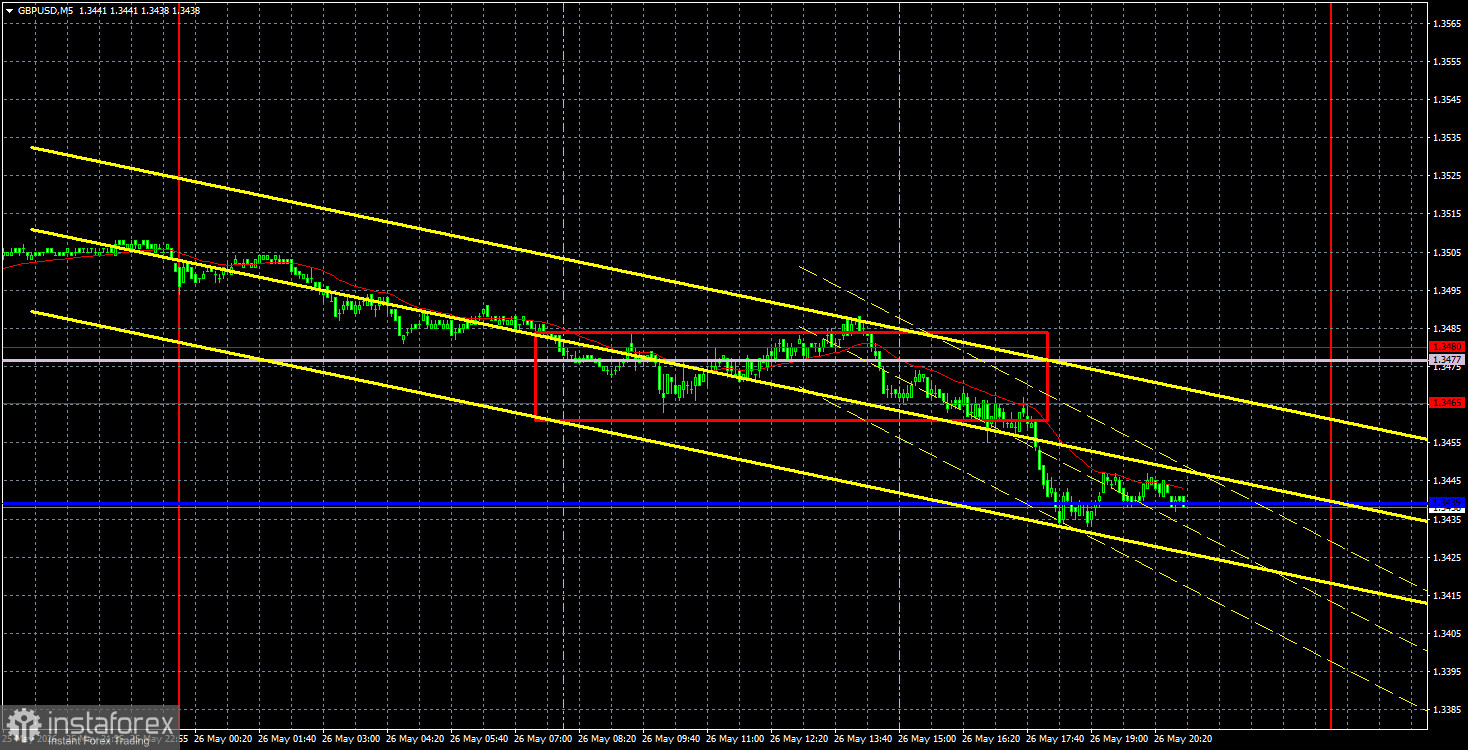
The GBP/USD currency pair could not withstand the pressure from the geopolitical backdrop on Tuesday and collapsed. Although the term "collapsed" may not fully apply to the movement observed. Rather, the British currency slightly decreased, but given the low volatility in recent days, this movement looked almost like a crash. The reasons for the decline of the British currency are clear. The U.S. attacked Iranian boats and missile installations near the Strait of Hormuz, putting the hypothetical agreement with Iran at risk of being derailed. Tehran may soon respond to America in kind, and whether negotiations will continue after this exchange of hostilities is a big question. We previously stated that we viewed the British currency's growth as a correction. It seems that the correction is now complete. If this leads to new escalations in the Middle East, the dollar will once again receive market support.
From a technical standpoint, on the hourly timeframe, the formation of the upward trend has ended, so we may observe a decline in the pair this week. The price has breached the trendline. Without geopolitical support, it will be difficult for the British currency to show growth in the near future, while macroeconomic and fundamental factors continue to be ignored by the market. In the near future, the dynamics of the British pound will depend not on technical factors, but rather on geopolitics. The market once again expects the worst and is preparing for it.
On the 5-minute timeframe, one sell signal was generated on Tuesday, but it took half a day to form. The pair breached the 1.3465-1.3480 area, allowing traders to open short positions. By the end of the day, the British pound rose by 15 pips and tested the critical line.
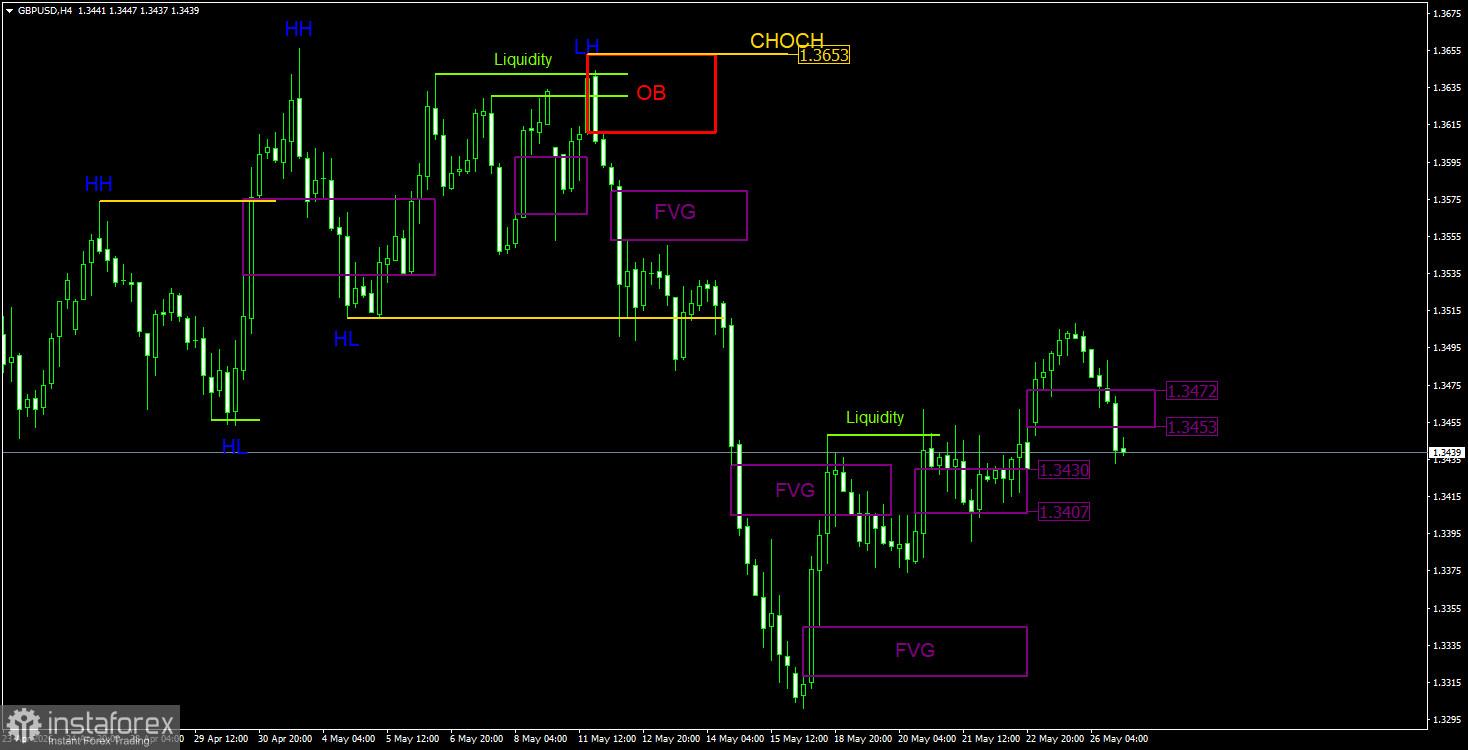
On the 4-hour timeframe, the British pound did not receive a follow-through reaction to the "bullish" FVG in the 1.3453-1.3472 area, and it consolidated below it, so we may observe a decline in the near future. A "bearish" FVG may form soon, which could be relevant given the high likelihood of the downward trend continuing. Thus, on Wednesday, traders should be interested only in the potential bearish FVG and the geopolitical backdrop.
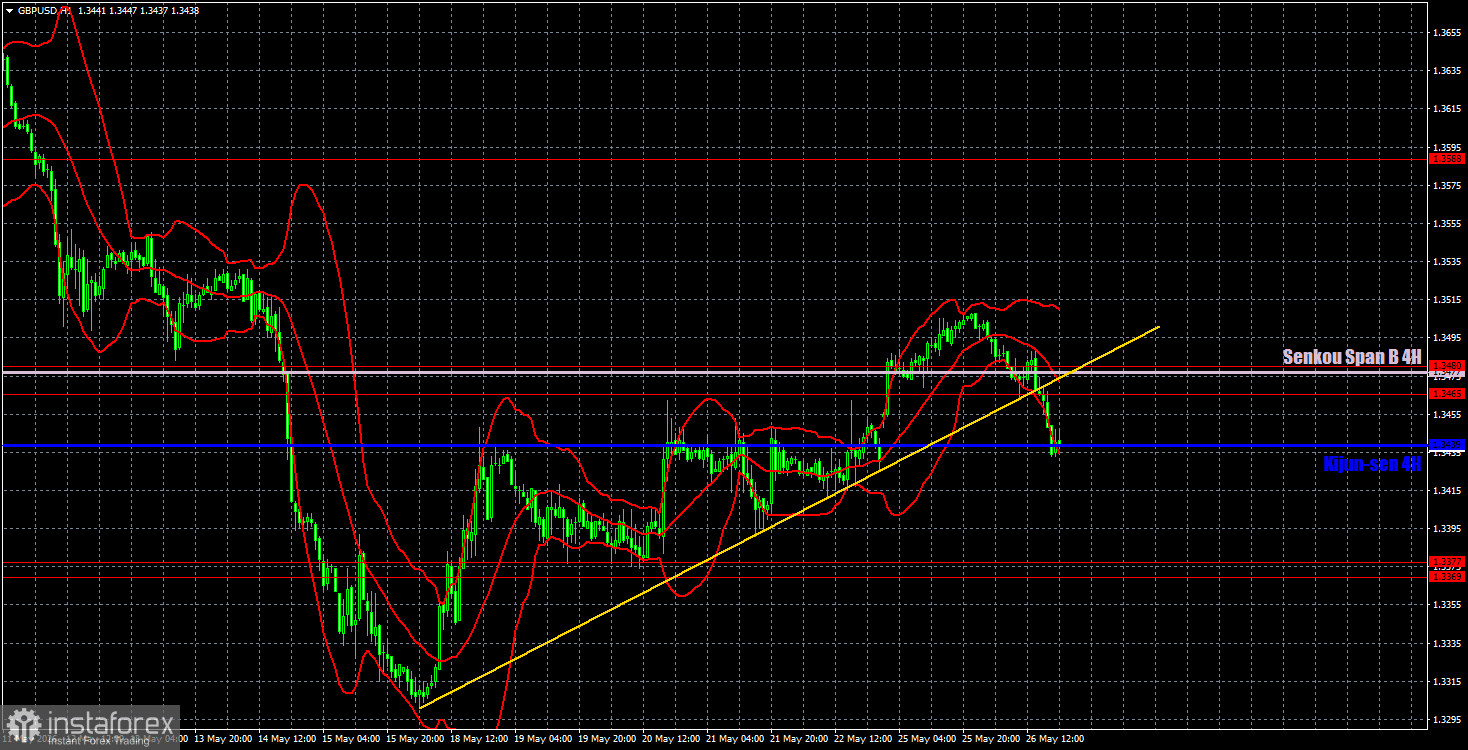
On the hourly timeframe, the GBP/USD pair has completed its upward trend amid the latest escalation over the Strait of Hormuz. The macroeconomic and fundamental backdrop continues to have little impact on the pair's movements, while geopolitics regularly provokes price swings in different directions. We do not believe that without a real escalation of the conflict in the Middle East, the dollar can exhibit strong growth. The American currency can only anticipate gains in the event of a breakdown in negotiations between Iran and the U.S.
For May 27, we highlight the following important levels: 1.3096-1.3115, 1.3179-1.3187, 1.3369-1.3377, 1.3465-1.3480, 1.3588, 1.3671-1.3681, 1.3751-1.3763. The Senkou Span B line (1.3477) and Kijun-sen (1.3439) may also serve as signal sources. It is recommended to set the Stop Loss to breakeven if the price moves in the correct direction by 20 pips. The lines of the Ichimoku indicator may shift throughout the day, which should be taken into account when determining trading signals.
On Wednesday, there are again no significant events scheduled in the UK or the U.S., so all attention remains focused on geopolitics. Trump's statements about coordinating a memorandum with Iran have not been confirmed by Tehran, and yesterday the U.S. struck targets in southern Iran, potentially jeopardizing the ceasefire, the agreement, and further negotiations.
Today, traders may open short positions targeting 1.3369-1.3377 if the pair consolidates below the Kijun-sen line. Long positions will become relevant after the 1.3465-1.3480 area is surpassed, targeting 1.3588. On the 4-hour timeframe, short positions are relevant and can be opened from a bearish FVG that may form shortly.


