Veja também

 10.02.2026 04:24 AM
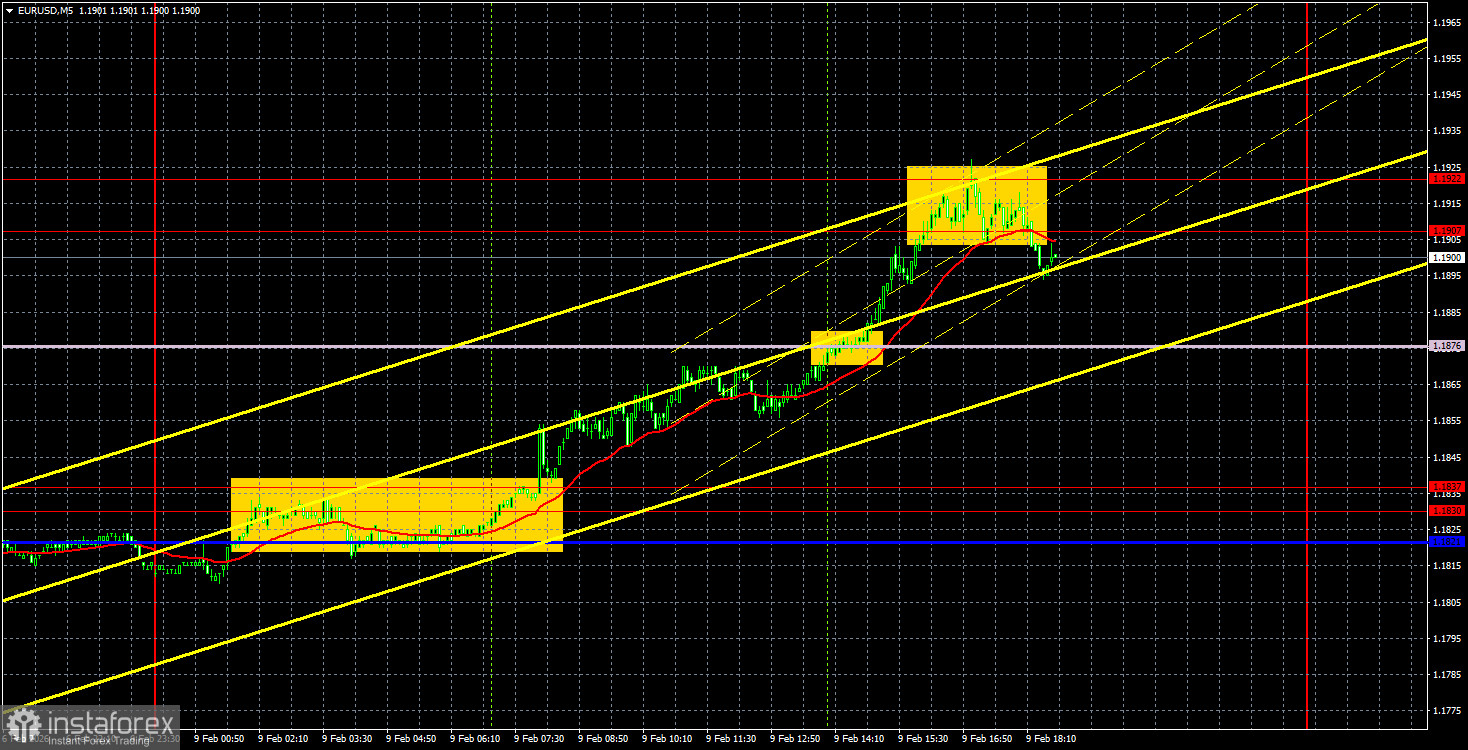
The EUR/USD currency pair soared on Monday, finishing the day around 1.1907-1.1922. The attempt to break through this area and the Senkou Span B line was unsuccessful on the first try, but overall, the euro began the week on a strong note. It is worth noting that there were no local reasons for the euro's rise on Monday. Among the significant events, only Christine Lagarde's speech is worth mentioning, which brought little to the markets. And she couldn't really provide anything important, as the last European Central Bank meeting was held the previous Thursday, and all necessary information had already been given to the markets by the ECB president.
Thus, the European currency rose purely on enthusiasm. But what kind of enthusiasm is present when there has been an upward trend in the pair for over a year? The euro spent a total of 7 months flat before finally breaking out of the sideways channel. The global upward trend has now resumed. Therefore, the euro should be expected to move north under any circumstances, as long as the upward trend remains. Hence, no local news support was needed on Monday.
On the 5-minute timeframe, the first buy signal was generated yesterday at the opening of the European trading session. The price broke through the 1.1821-1.1837 area, allowing traders to open long positions. At the beginning of the American trading session, the Senkou Span B line was crossed, and a few hours later, the area of 1.1907-1.1922 was worked out. Around this area, traders could take profits from long positions.
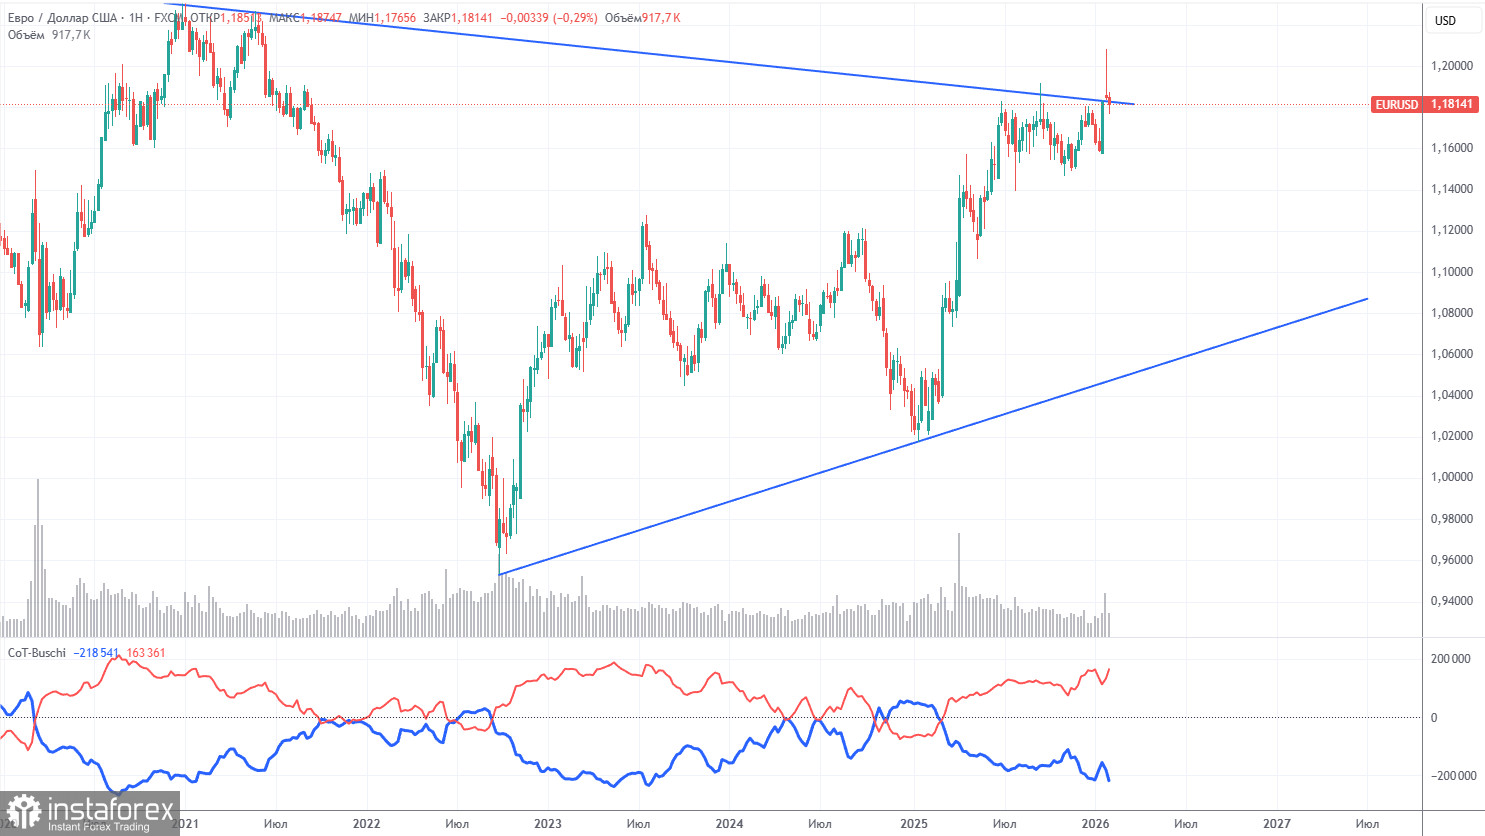
The latest COT report is dated February 3. In the illustration of the weekly timeframe, it is clear that the net position of non-commercial traders remains "bullish." Since Trump took office as president of the United States for the second time, the dollar has only been falling. We cannot say with 100% certainty that the decline of the American currency will continue, but current developments worldwide hint at this possibility.
We still do not see any fundamental factors that would strengthen the European currency, but there are enough factors for the decline of the American dollar. The global downward trend is still intact, but what relevance does it have now, given the price movements over the past 18 years? In the last three years, a new upward trend has been forming, and the breakout of the global descending trend line has occurred. Thus, the path further north is open.
The positioning of the red and blue lines of the indicator continues to indicate the maintenance of a "bullish" trend. During the last reporting week, the number of longs among the "Non-commercial" group increased by 11,900, while the number of shorts decreased by 19,300. Consequently, the net position increased by another 31,200 contracts for the week.
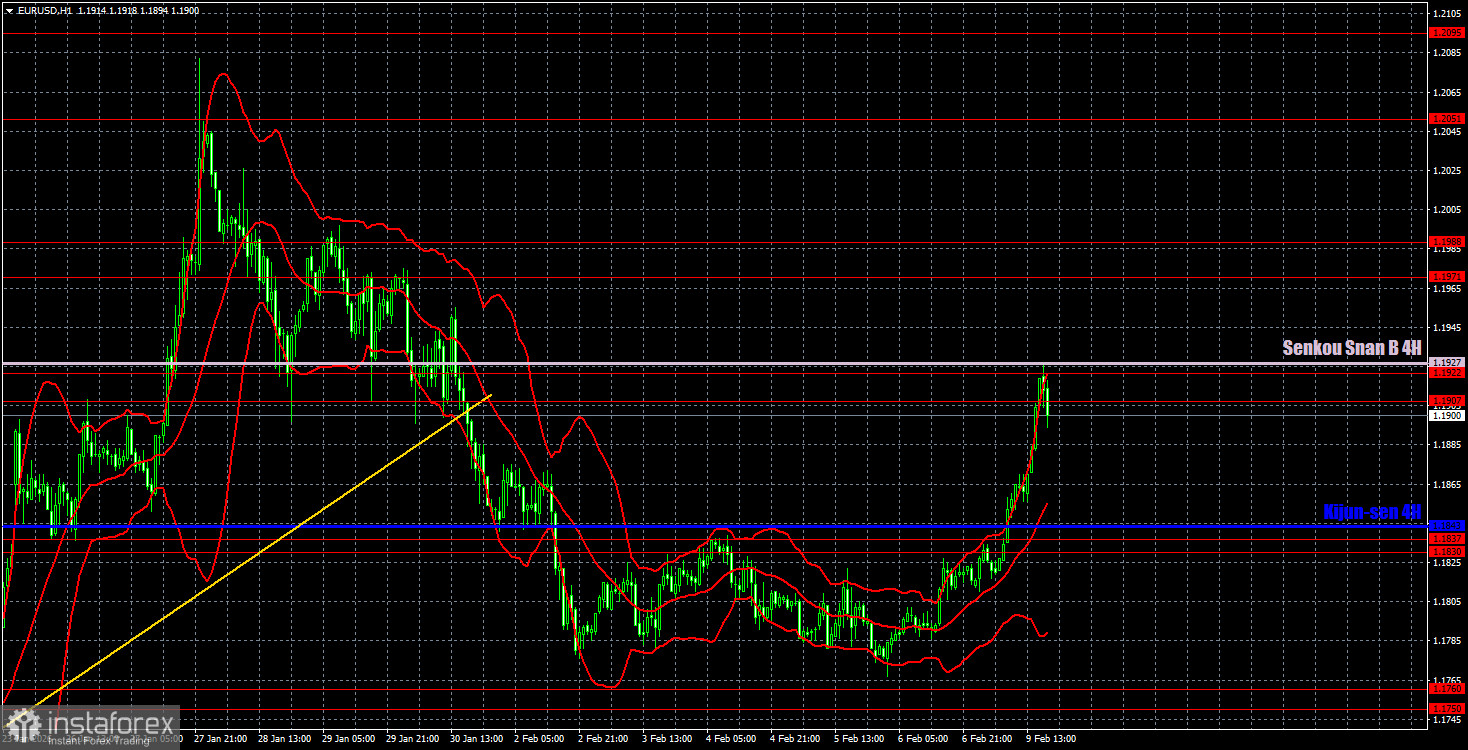
On the hourly timeframe, the EUR/USD pair continues to form an upward trend despite breaking the trend line and a correction. The pair has officially left the sideways channel of 1.1400-1.1830, where it spent seven months, thus the upward trend is officially resumed. For the technical restoration of the upward trend, price consolidation above the Senkou Span B line is now required.
For February 10, we highlight the following levels for trading: 1.1362, 1.1426, 1.1542, 1.1604-1.1615, 1.1657-1.1666, 1.1750-1.1760, 1.1830-1.1837, 1.1907-1.1922, 1.1971-1.1988, 1.2051, 1.2095, as well as the Senkou Span B line (1.1927) and the Kijun-sen line (1.1843). The Ichimoku indicator lines may move during the day, which should be taken into account when determining trading signals. Do not forget to set a stop-loss order at breakeven if the price moves in the right direction by 15 pips. This will protect against potential losses if the signal turns out to be false.
On Tuesday, there are no important events planned in the Eurozone. In the US, a rather interesting retail sales report will be published, along with a secondary ADP report on a weekly basis. We believe that if the Senkou Span B line is broken, the movement to the north will continue regardless.
On Tuesday, traders may trade from the area of 1.1907-1.1922. New longs will become relevant if the price consolidates above this area and the Senkou Span B line, with a target of 1.1971-1.1988. Short positions can be considered upon a bounce from the area of 1.1907-1.1927 with a target of 1.1843.


