یہ بھی دیکھیں

 04.08.2025 10:28 AM
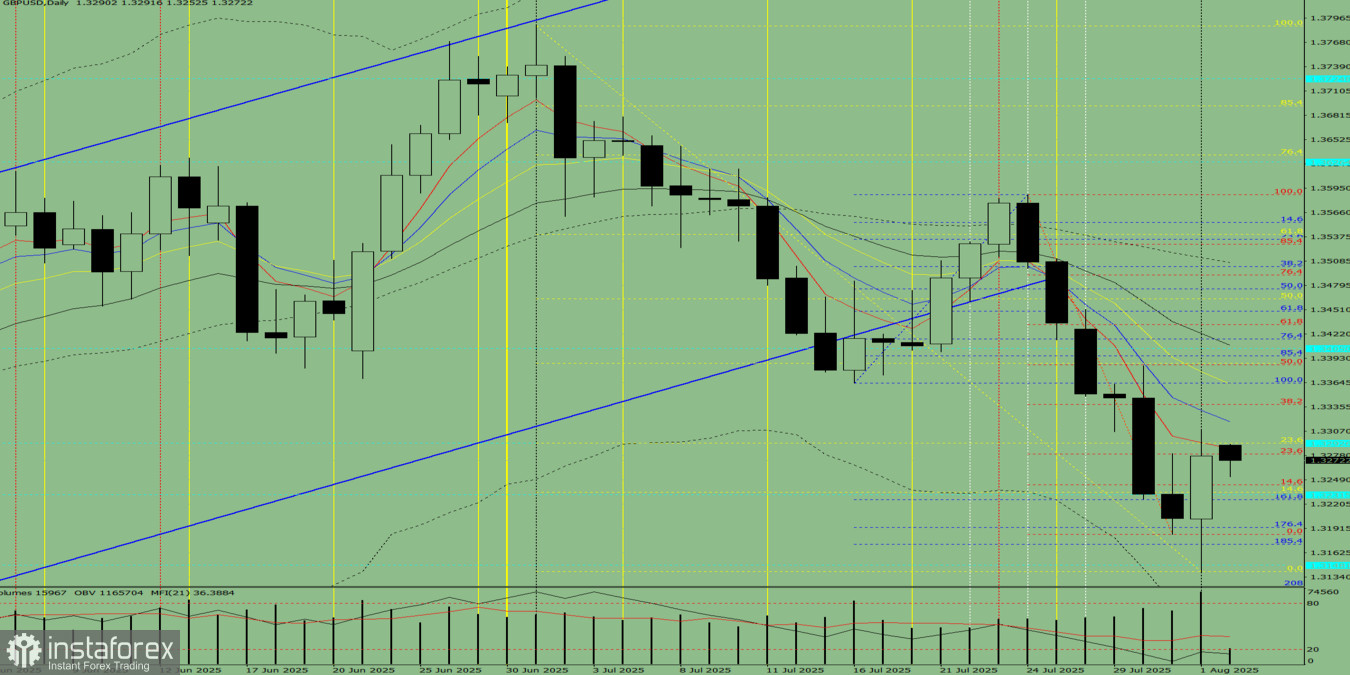
Fig. 1 (Daily Chart)
Comprehensive Analysis:
Overall Conclusion: Upward trend.
Alternative Scenario: From the 1.3278 level (Friday's daily candle close), the price may start a corrective move downward toward 1.3243 – the 14.6% retracement level (red dotted line). Upon testing this level, the price may continue upward toward 1.3364 – the upper fractal (blue dotted line). After reaching this level, a potential pullback may occur toward 1.3338 – the 38.2% retracement level (red dotted line).
You have already liked this post today
*تعینات کیا مراد ہے مارکیٹ کے تجزیات یہاں ارسال کیے جاتے ہیں جس کا مقصد آپ کی بیداری بڑھانا ہے، لیکن تجارت کرنے کے لئے ہدایات دینا نہیں.


