
یہ بھی دیکھیں


 25.08.2026 08:09 AM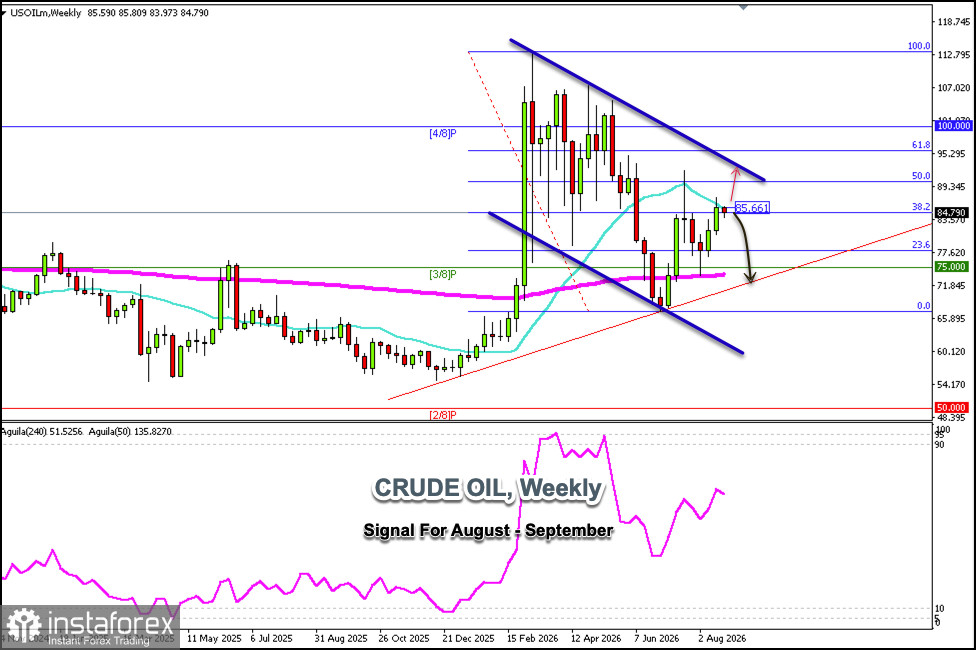
Crude oil is trading around $84.79. The weekly chart shows that, following the rally above $66, crude oil reached the 38.2% Fibonacci level and could continue to rise in the coming days until it reaches the 61.8% level, around $96.
Crude oil has left a gap around $95, and from a technical perspective, before going on with its downtrend, the instrument might continue rising and fill this technical gap.
If, in the coming days, crude oil consolidates below the 21-period simple moving average (SMA) at $85.66, we could continue selling in anticipation of the price reaching the 23.6% Fibonacci level around $78. Ultimately, crude oil could find strong support around the 3/8 Murray level at $75, which also coincides with the 200-period simple moving average (SMA).
Since the trend for crude oil remains bullish, a consolidation above $86 could extend the uptrend, and we could expect it to reach the 50% Fibonacci retracement level—the high reached in July. We also anticipate it will reach the psychological level of $100 in the coming weeks.
According to the weekly chart, oil has upside potential, so any pullback toward the 200-day EMA or the 3/8 Murray level could be considered an opportunity to open long positions.
You have already liked this post today
*تعینات کیا مراد ہے مارکیٹ کے تجزیات یہاں ارسال کیے جاتے ہیں جس کا مقصد آپ کی بیداری بڑھانا ہے، لیکن تجارت کرنے کے لئے ہدایات دینا نہیں.


