یہ بھی دیکھیں

 12.02.2025 09:21 AM
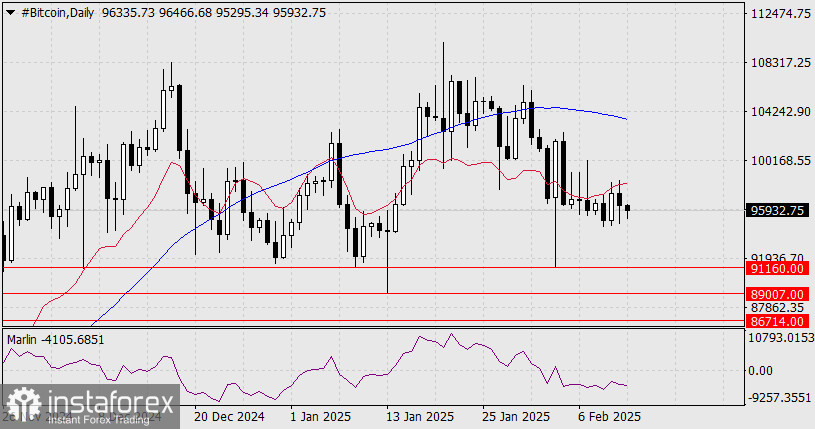
On the daily chart, Bitcoin has struggled to break above the balance indicator line (red moving average), indicating that market participants are focused on selling. The Marlin oscillator continues to decline within bearish territory, reinforcing the downward trend.
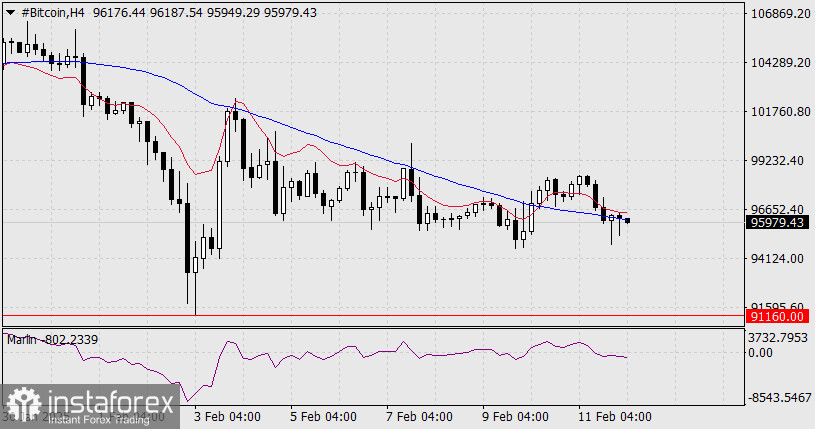
On the four-hour chart, Bitcoin has broken below the MACD line and remains significantly under the balance line, confirming a short-term downtrend. The Marlin oscillator's signal line is also moving deeper into the bearish zone, suggesting that the downtrend may accelerate, with a target of $91,160 in the near term.
You have already liked this post today
*تعینات کیا مراد ہے مارکیٹ کے تجزیات یہاں ارسال کیے جاتے ہیں جس کا مقصد آپ کی بیداری بڑھانا ہے، لیکن تجارت کرنے کے لئے ہدایات دینا نہیں.


