یہ بھی دیکھیں

 23.02.2022 03:47 PM
EUR/USD
Analysis:
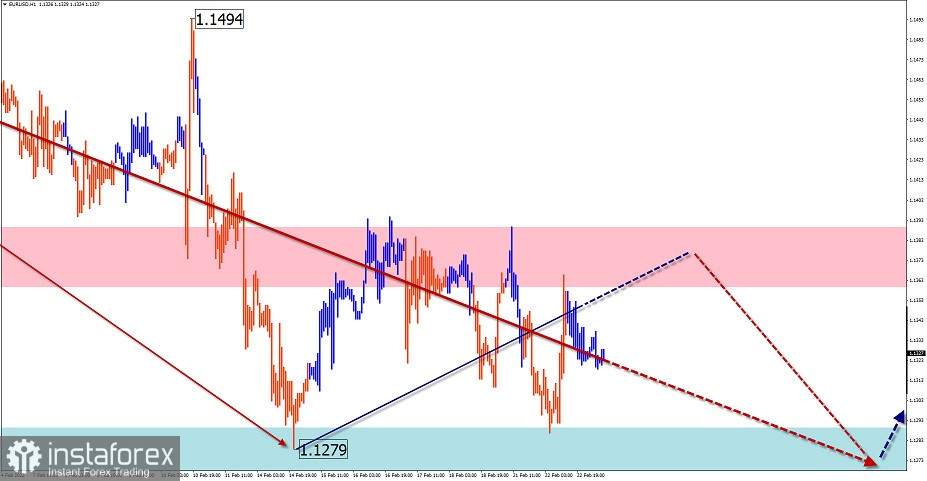
The wave construction of the European currency chart, which has not been completed for today, has been reported since January 28. This rising wave has a reversal potential. If it is confirmed, the wave will give rise to a new short-term trend. The downward section of the last two weeks has not yet gone beyond the correction.
Forecast:
Today, the price is expected to move between the nearest oncoming zones. In the first half of the day, a downward course is more likely. At the end of the day or tomorrow in the area of settlement support, you can expect a reversal and a resumption of the price rise.
Potential reversal zones
Resistance:
- 1.1360/1.1390
Support:
- 1.1290/1.1260
Recommendations:
Euro trading in the near future can bring profit only in the form of short-term transactions in a small lot. Purchases will become possible after the appearance of confirmed reversal signals in the area of the support zone.
USD/JPY
Analysis:
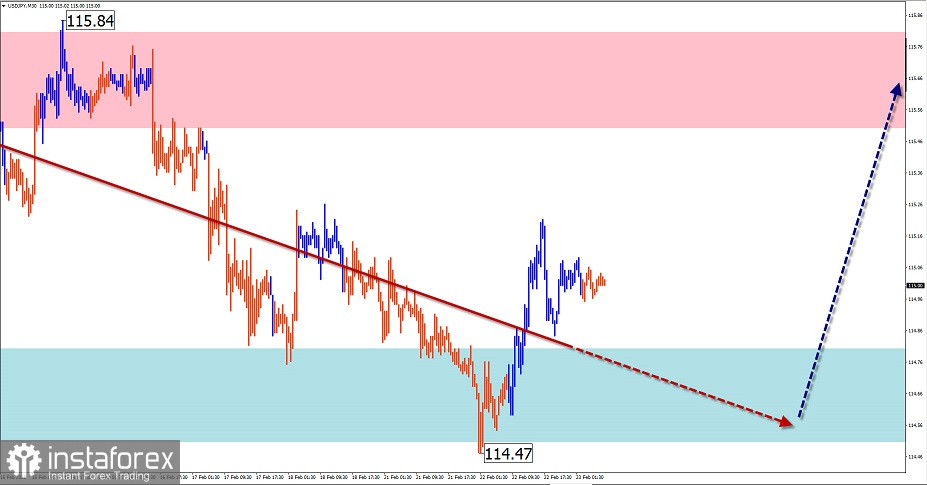
The trend rate of the Japanese yen major in the last two years is set by the ascending wave algorithm. Quotes are currently located within the boundaries of the resistance zone of the senior TF. The unfinished section has been counting since November 30 last year. In the last two weeks, the price in sideways flat forms an intermediate pullback.
Forecast:
On the current day, the price is expected to move from the lower border of the price corridor to the area of the calculated resistance. At the European session, pressure on the support zone is not excluded, with a short-term puncture of the lower border.
Potential reversal zones
Resistance:
- 115.50/115.80
Support:
- 114.80/114.50
Recommendations:
Today, short-term purchases with a fractional lot from the support zone are possible on the yen chart. It is recommended to close deals at the first signs of an imminent reversal.
GBP/JPY
Analysis:
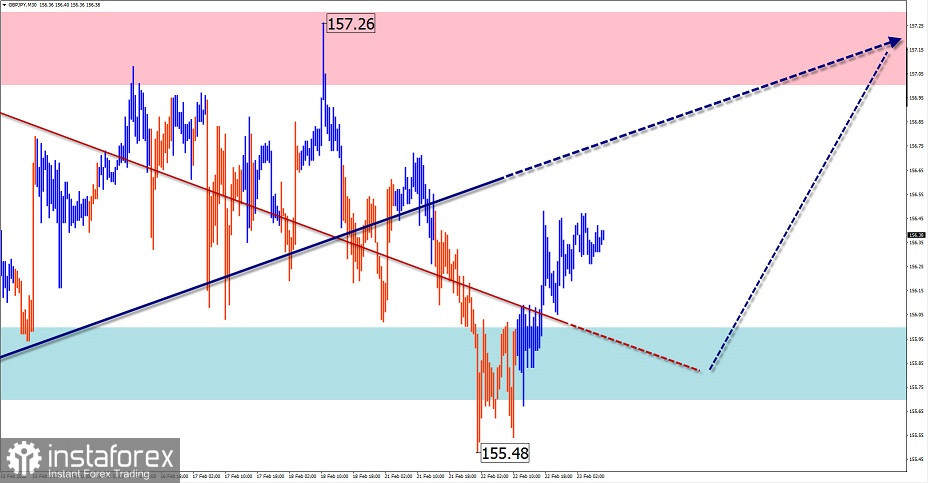
Over the past two years, the ascending wave algorithm has brought the quotes of the pound/yen cross to the area of a strong reversal zone of the weekly scale of the chart. The incomplete short-term wave at the main exchange rate has been counting since November last year. In its structure, in the last two weeks, the price has been moving sideways, forming an intermediate correction.
Forecast:
Today, the general flat mood of the pair's movement is expected to continue. In the first half of the day, a downward vector is not excluded, with a price decline any further than the support zone. At the end of the day or tomorrow, you can count on a change of direction and an increase in quotes, up to the resistance zone.
Potential reversal zones
Resistance:
- 157.00/157.30
Support:
- 156.00/155.70
Recommendations:
Sales of the pair are risky today and can lead to losses. It is recommended to refrain from entering the pair's market until confirmed buy signals appear in the support area.
GOLD
Analysis:
The rising wave brought gold quotes to the area of the strong resistance of a large TF. Before continuing the rise, the structure needs to increase its wave level in correction.
Forecast:
In the next day, the price is expected to move sideways with a common downward vector. The preliminary target zone runs along the upper boundary of the large-scale support zone.
Potential reversal zones
Resistance:
- 1905.0/1910.0
Support:
- 1875.0/1870.0
Recommendations:
Short-term fractional lot sales are possible until the current decline is completed. It is optimal to refrain from entering the market of the instrument until the confirmed buy signals appear in the area of the support zone.
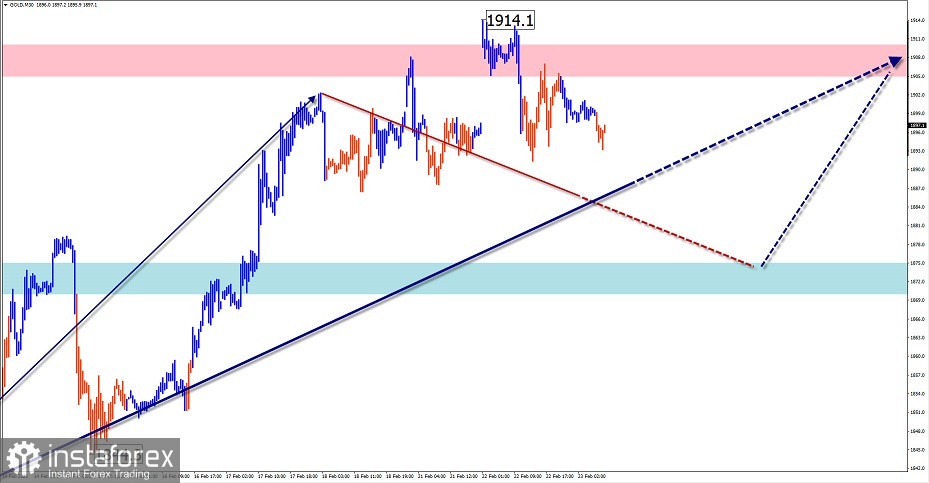
Explanations: In the simplified wave analysis (UVA), waves consist of 3 parts (A-B-C). The last incomplete wave is analyzed. The solid background of the arrows shows the formed structure, and the dotted one shows the expected movements.
Attention: The wave algorithm does not take into account the duration of the movements of the instrument in time!


