Double Bottom
was formed on 21.05 at 10:00:05 (UTC+0)
signal strength 3 of 5
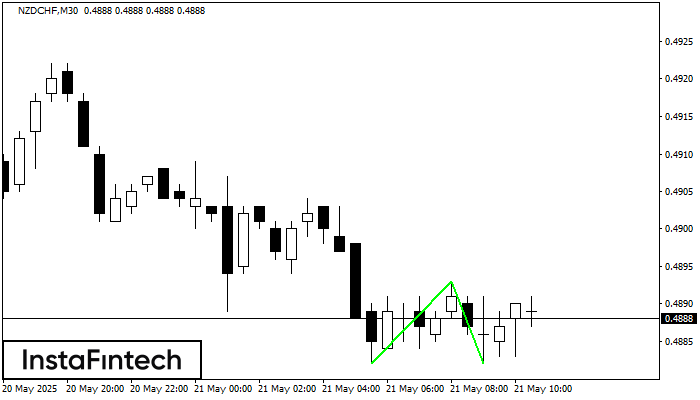
The Double Bottom pattern has been formed on NZDCHF M30. Characteristics: the support level 0.4882; the resistance level 0.4893; the width of the pattern 11 points. If the resistance level is broken, a change in the trend can be predicted with the first target point lying at the distance of 11 points.
See Also
- All
- All
- Bearish Rectangle
- Bearish Symmetrical Triangle
- Bullish Rectangle
- Double Top
- Double Top
- Triple Bottom
- Triple Bottom
- Triple Top
- Triple Top
- All
- All
- Buy
- Sale
- All
- 1
- 2
- 3
- 4
- 5
Rectángulo Bajista
was formed on 30.07 at 02:34:34 (UTC+0)
signal strength 4 of 5
Según el gráfico de H1, GBPJPY formó el Rectángulo Bajista. Este tipo de patrón indica la continuación de una tendencia. Esto consiste de dos niveles: resistencia 198.43 - 0.00
Open chart in a new window
Doble Techo
was formed on 30.07 at 00:00:19 (UTC+0)
signal strength 3 of 5
El patrón de reversión Doble Techo ha sido formado en GBPCHF M30. Características: el límite superior 1.0764; el límite inferior 1.0747; el ancho del patrón es 16 puntos. Es mejor
Open chart in a new window
Doble Techo
was formed on 29.07 at 22:45:35 (UTC+0)
signal strength 2 of 5
En el gráfico de NZDCAD M15 el patrón de reversión Doble Techo ha sido formado. Características: límite superior 0.8204; límite inferior 0.8193; el ancho del patrón 11 puntos. La señal
Los marcos de tiempo M5 y M15 pueden tener más puntos de entrada falsos.
Open chart in a new window