Бычий вымпел
сформирован 23.04 в 19:30:51 (UTC+0)
сила сигнала 4 из 5

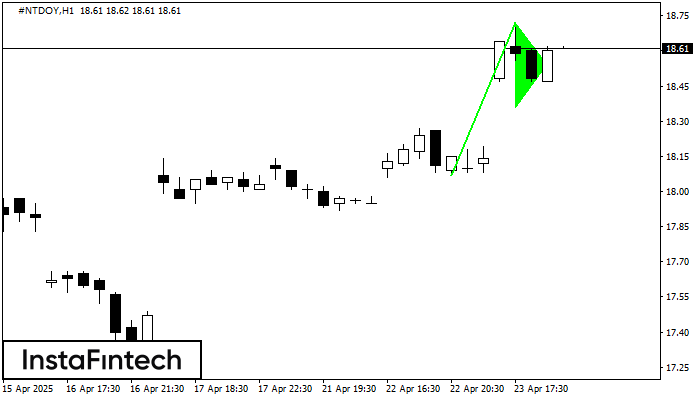
На графике #NTDOY H1 сформировался паттерн «Бычий вымпел», который относится к фигуре продолжения тренда. Можно предполагать, что, в случае фиксации цены выше максимума вымпела 18.72, возможно дальнейшее восходящее движение.
Шунингдек кўринг
- Все
- Все
- Bearish Rectangle
- Bearish Symmetrical Triangle
- Bullish Rectangle
- Double Top
- Double Top
- Triple Bottom
- Triple Bottom
- Triple Top
- Triple Top
- Все
- Все
- Покупка
- Продажа
- Все
- 1
- 2
- 3
- 4
- 5
Triple Bottom
сформирован 19.09 в 00:31:35 (UTC+0)
сила сигнала 3 из 5
The Triple Bottom pattern has been formed on AUDUSD M30. It has the following characteristics: resistance level 0.6660/0.6624; support level 0.6615/0.6609; the width is 45 points. In the event
Открыть график инструмента в новом окне
Double Top
сформирован 19.09 в 00:15:26 (UTC+0)
сила сигнала 1 из 5
On the chart of GBPJPY M5 the Double Top reversal pattern has been formed. Characteristics: the upper boundary 200.56; the lower boundary 200.38; the width of the pattern 18 points
The M5 and M15 time frames may have more false entry points.
Открыть график инструмента в новом окне
Triple Bottom
сформирован 18.09 в 22:46:03 (UTC+0)
сила сигнала 2 из 5
The Triple Bottom pattern has been formed on NZDCAD M15. It has the following characteristics: resistance level 0.8119/0.8115; support level 0.8103/0.8105; the width is 16 points. In the event
The M5 and M15 time frames may have more false entry points.
Открыть график инструмента в новом окне