Двойная вершина
сформирован 21.04 в 14:39:59 (UTC+0)
сила сигнала 1 из 5

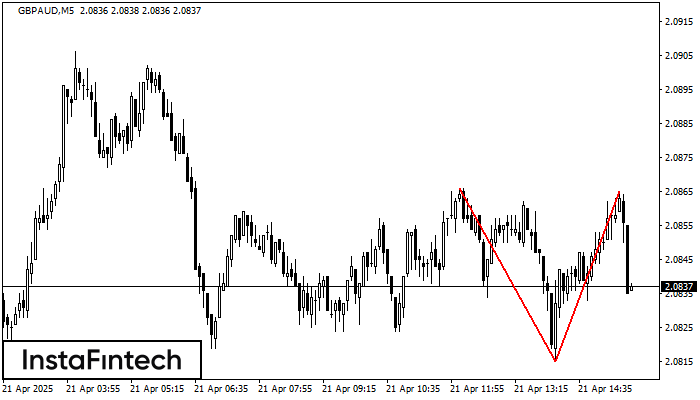
По GBPAUD на M5 сформировалась разворотная фигура «Двойная вершина». Характеристика: Верхняя граница 2.0866; Нижняя граница 2.0815; Ширина фигуры 50 пунктов. Позицию на продажу возможно открыть ниже нижней границы 2.0815, с перспективой хода к уровню 2.0800.
Таймфреймы М5 и М15 могут иметь больше ложных точек входа.
Шунингдек кўринг
- Все
- Все
- Bearish Rectangle
- Bearish Symmetrical Triangle
- Bullish Rectangle
- Double Top
- Double Top
- Triple Bottom
- Triple Bottom
- Triple Top
- Triple Top
- Все
- Все
- Покупка
- Продажа
- Все
- 1
- 2
- 3
- 4
- 5
Bullish Rectangle
was formed on 04.07 at 22:12:11 (UTC+0)
signal strength 3 of 5
According to the chart of M30, EURCAD formed the Bullish Rectangle which is a pattern of a trend continuation. The pattern is contained within the following borders: the lower border
Open chart in a new window
Bullish Rectangle
was formed on 01.07 at 20:04:35 (UTC+0)
signal strength 3 of 5
According to the chart of M30, NZDCAD formed the Bullish Rectangle which is a pattern of a trend continuation. The pattern is contained within the following borders: the lower border
Open chart in a new window
Bearish Rectangle
was formed on 01.07 at 08:02:10 (UTC+0)
signal strength 3 of 5
According to the chart of M30, GBPCHF formed the Bearish Rectangle. The pattern indicates a trend continuation. The upper border is 1.0892, the lower border is 1.0875. The signal means
Open chart in a new window