Тройная вершина
сформирован 09.04 в 23:20:13 (UTC+0)
сила сигнала 1 из 5

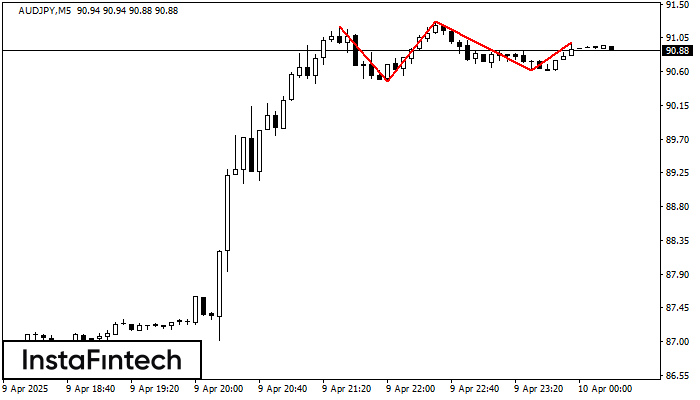
На графике AUDJPY M5 образовалась фигура «Тройная вершина». Данная фигура относится к типу разворотных и имеет характеристику: Верхняя граница 91.20/90.98; Нижняя граница 90.47/90.61; Ширина фигуры 65 пунктов. Прогноз: В случае пробоя нижней границы 90.47 вероятно дальнейшее нисходящее движение к уровню 91.11.
Таймфреймы М5 и М15 могут иметь больше ложных точек входа.
Шунингдек кўринг
- Все
- Все
- Bearish Rectangle
- Bearish Symmetrical Triangle
- Bullish Rectangle
- Double Top
- Double Top
- Triple Bottom
- Triple Bottom
- Triple Top
- Triple Top
- Все
- Все
- Покупка
- Продажа
- Все
- 1
- 2
- 3
- 4
- 5
Bearish pennant
was formed on 15.08 at 01:17:12 (UTC+0)
signal strength 1 of 5
The Bearish pennant pattern has formed on the GBPAUD M5 chart. The pattern signals continuation of the downtrend in case the pennant’s low of 2.0808 is broken through. Recommendations: Place
The M5 and M15 time frames may have more false entry points.
Open chart in a new window
Double Bottom
was formed on 15.08 at 00:00:20 (UTC+0)
signal strength 3 of 5
The Double Bottom pattern has been formed on AUDCHF M30; the upper boundary is 0.5251; the lower boundary is 0.5241. The width of the pattern is 11 points. In case
Open chart in a new window
Double Bottom
was formed on 15.08 at 00:00:19 (UTC+0)
signal strength 3 of 5
The Double Bottom pattern has been formed on NZDCHF M30. Characteristics: the support level 0.4773; the resistance level 0.4781; the width of the pattern 8 points. If the resistance level
Open chart in a new window