Медвежий вымпел
сформирован 07.04 в 01:30:15 (UTC+0)
сила сигнала 3 из 5
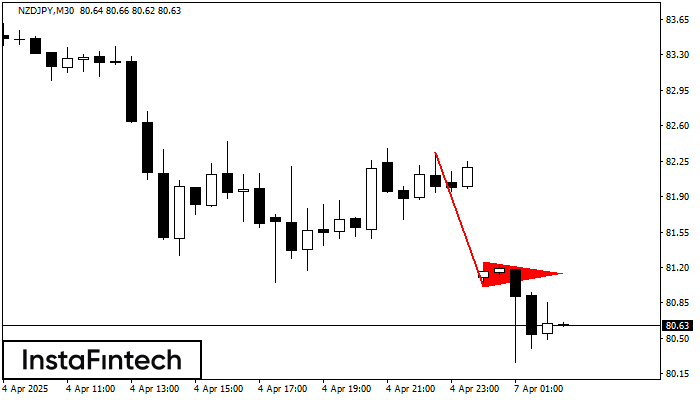
По торговому инструменту NZDJPY на M30 сформировалась графическая фигура «Медвежий вымпел». Фигура данного типа характеризует небольшое замедление, после которого движение продолжится в исходном тренде. В случае если котировке удастся зафиксироваться ниже минимума образованной фигуры 81.01, трейдеру представится возможность удачно войти в позицию на продажу.
Шунингдек кўринг
- Все
- Все
- Bearish Rectangle
- Bearish Symmetrical Triangle
- Bullish Rectangle
- Double Top
- Double Top
- Triple Bottom
- Triple Bottom
- Triple Top
- Triple Top
- Все
- Все
- Покупка
- Продажа
- Все
- 1
- 2
- 3
- 4
- 5
Bullish Rectangle
was formed on 19.08 at 00:09:48 (UTC+0)
signal strength 1 of 5
According to the chart of M5, AUDJPY formed the Bullish Rectangle. The pattern indicates a trend continuation. The upper border is 95.99, the lower border is 95.89. The signal means
The M5 and M15 time frames may have more false entry points.
Open chart in a new window
Bearish Symmetrical Triangle
was formed on 18.08 at 23:14:57 (UTC+0)
signal strength 1 of 5
According to the chart of M5, GBPJPY formed the Bearish Symmetrical Triangle pattern. This pattern signals a further downward trend in case the lower border 199.54 is breached. Here
The M5 and M15 time frames may have more false entry points.
Open chart in a new window
Head and Shoulders
was formed on 18.08 at 23:00:17 (UTC+0)
signal strength 1 of 5
According to the chart of M5, AUDJPY formed the Head and Shoulders pattern. The Head’s top is set at 95.98 while the median line of the Neck is found
The M5 and M15 time frames may have more false entry points.
Open chart in a new window