Bullish Rectangle
was formed on 24.04 at 18:29:03 (UTC+0)
signal strength 4 of 5

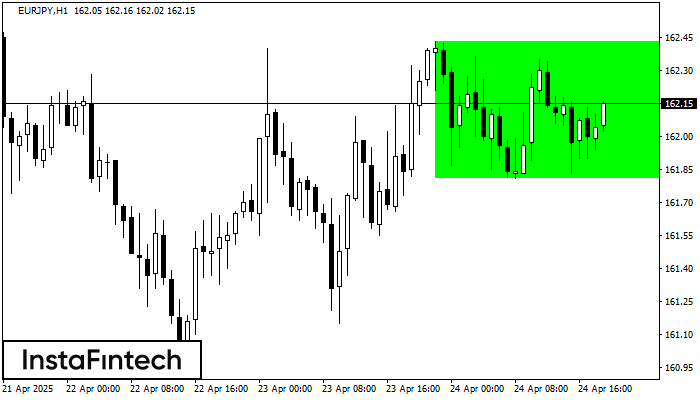
According to the chart of H1, EURJPY formed the Bullish Rectangle. The pattern indicates a trend continuation. The upper border is 162.43, the lower border is 161.81. The signal means that a long position should be opened above the upper border 162.43 of the Bullish Rectangle.
Juga lihat
- All
- All
- Bearish Rectangle
- Bearish Symmetrical Triangle
- Bullish Rectangle
- Double Top
- Double Top
- Triple Bottom
- Triple Bottom
- Triple Top
- Triple Top
- All
- All
- Buy
- Sale
- All
- 1
- 2
- 3
- 4
- 5
डबल बॉटम
was formed on 22.07 at 19:45:55 (UTC+0)
signal strength 2 of 5
डबल बॉटम पैटर्न #NTDOY M15 पर बना है; ऊपरी सीमा 22.32 है; निचली सीमा 21.70 है। पैटर्न की चौड़ाई 64 अंक है। ऊपरी सीमा 22.32 के टूटने के मामले में
M5 और M15 समय सीमा में अधिक फाल्स एंट्री पॉइंट्स हो सकते हैं।
Open chart in a new window
डबल बॉटम
was formed on 22.07 at 19:45:53 (UTC+0)
signal strength 2 of 5
डबल बॉटम पैटर्न #NTDOY M15 पर बना है। विशेषताएं: समर्थन स्तर 21.68; प्रतिरोध स्तर 22.32; पैटर्न की चौड़ाई 64 पॉइंट्स। यदि प्रतिरोध स्तर टूट जाता है, तो रुझान में बदलाव
M5 और M15 समय सीमा में अधिक फाल्स एंट्री पॉइंट्स हो सकते हैं।
Open chart in a new window
हेड एण्ड शोल्डर्स
was formed on 21.07 at 21:30:28 (UTC+0)
signal strength 3 of 5
#TSLA M30 ने निम्न विशेषताओं के साथ हेड एण्ड शोल्डर्स पैटर्न का गठन किया: हेड का टॉप 337.71 पर है, नेकलाइन और ऊपर का कोण 324.60/326.66 पर है। इस पैटर्न
Open chart in a new window