Lihat juga

 12.02.2026 04:35 AM
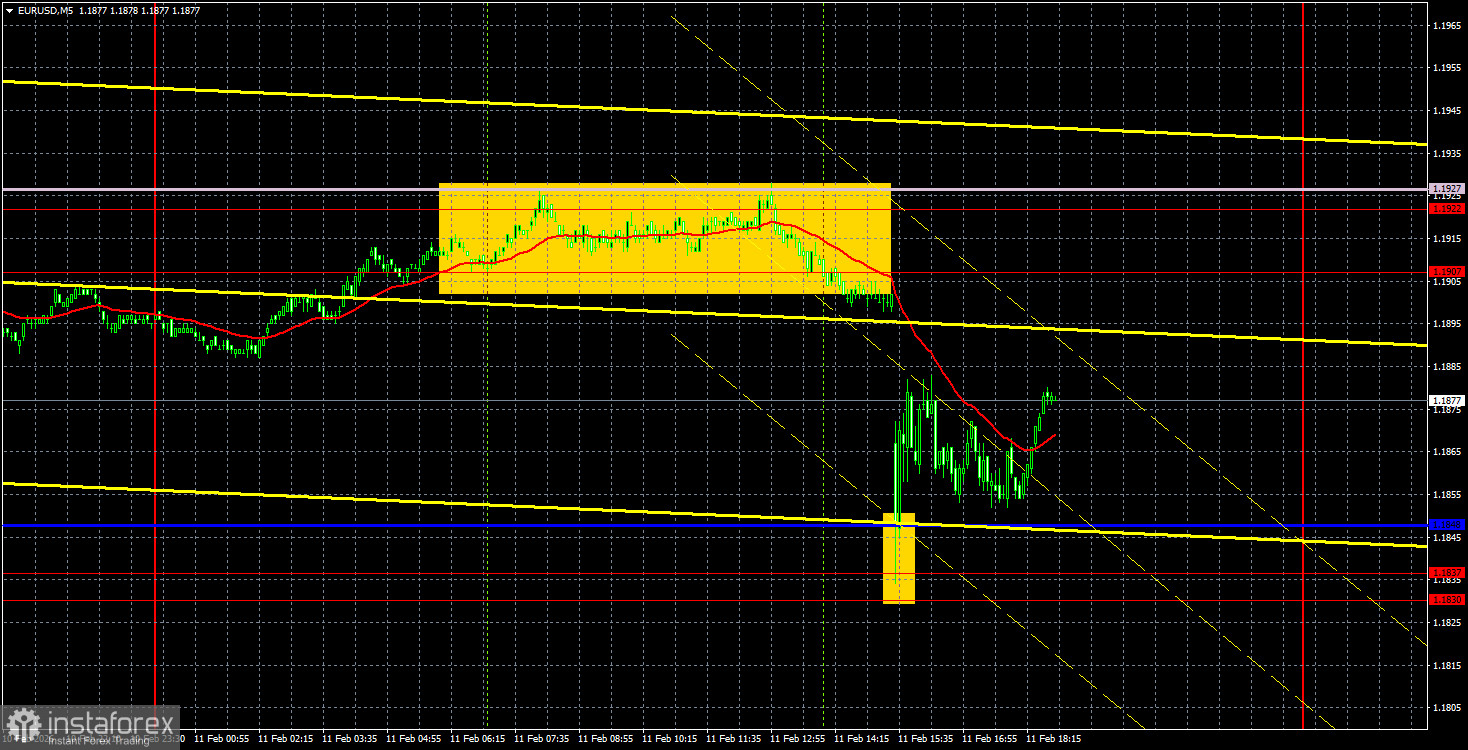
The EUR/USD currency pair traded on Wednesday in full accordance with the macroeconomic backdrop. Yesterday, important reports on Non-Farm Payrolls and the unemployment rate were published in the US, and the market clearly did not expect the resulting figures. It turned out that 130,000 new jobs were created in January outside the agricultural sector, far more than experts had predicted. Additionally, the unemployment rate dropped from 4.4% to 4.3%. Thus, both reports provided significant support for the American currency, but they did not particularly impress traders.
To be frank, with such strong data, the dollar could have gained more than 100 pips and continued to rise, as the likelihood of a new rate cut from the Fed sharply diminished after the data release. At the moment, the American currency rose by approximately 85 pips, but over the next few hours, it lost almost "everything it had worked hard to gain." Thus, the strong labor market data effectively had no positive impact on the dollar.
From a technical standpoint, the pair traded just below the area of 1.1907-1.1922 for several consecutive days, then bounced off it, fell to the Kijun-sen line and the area of 1.1830-1.1837, and bounced off again. Formally, the trend remains downward, as the price remains below the Senkou Span B line. However, the pair has also failed to break below this critical line. Therefore, we do not currently see any signs of a revival of the downward trend. The market has shown that it values the US labor market data, but this is not the main reason for the dollar's unpopularity over the past year.
On the 5-minute timeframe, two trading signals were formed yesterday. Precisely at the time of the US reports release, the price bounced off the 1.1907-1.1922 area and then dropped sharply. Consequently, there was no opportunity to capitalize on this signal. However, traders could have successfully executed a long position from the bounce off the 1.1830-1.1837 area and the critical line. By the evening, this position was in a good profit.
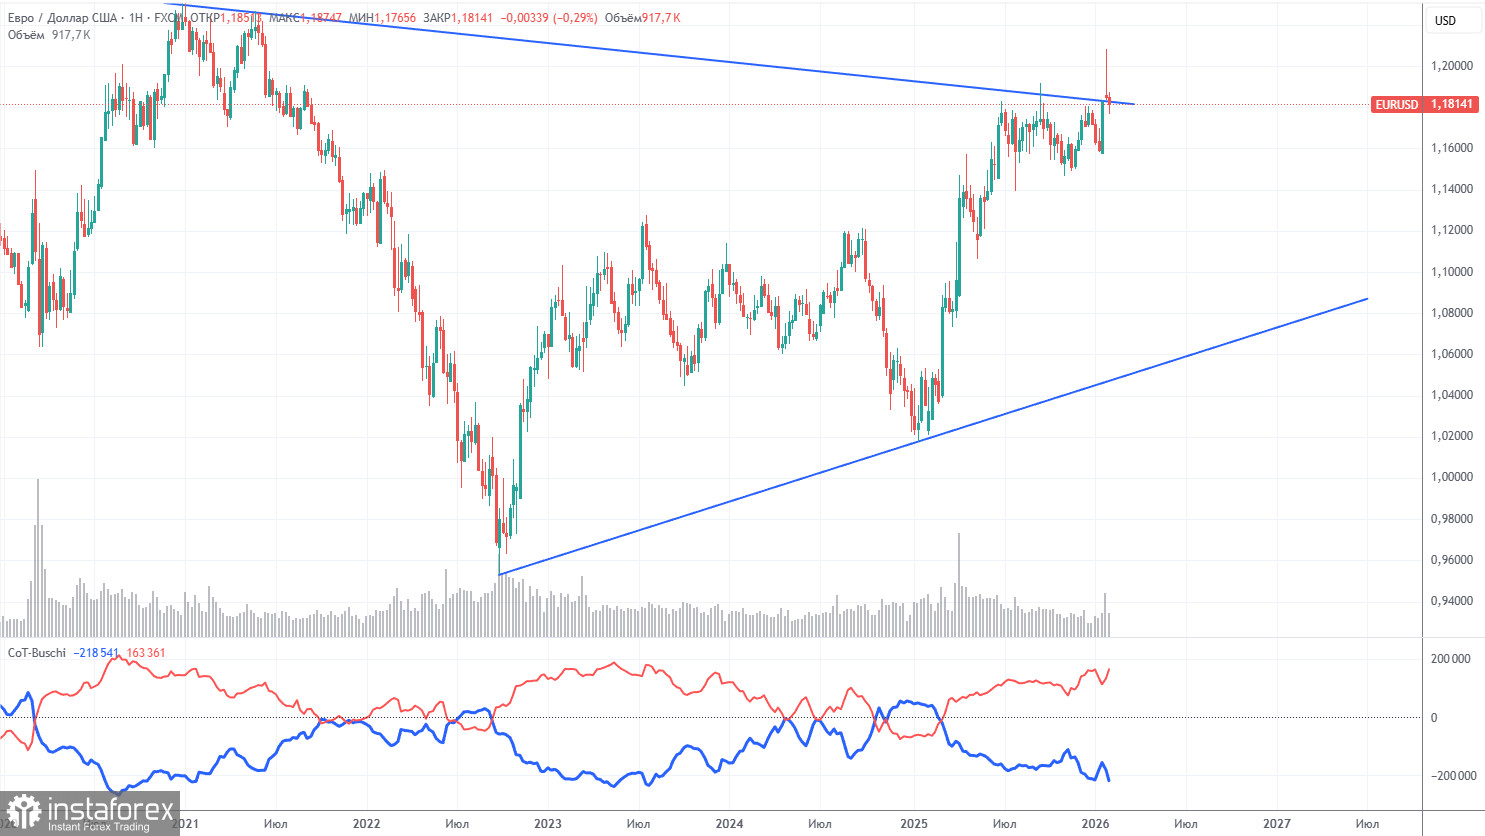
The latest COT report is dated February 3. The illustration on the weekly timeframe clearly shows that the net position of non-commercial traders remains "bullish." Since Trump took office as President of the United States for the second time, only the dollar has fallen. We cannot state with 100% certainty that the decline of the American currency will continue, but current developments worldwide suggest this is a possibility.
We still do not see any fundamental factors that would strengthen the European currency, while there are plenty of factors that would weaken the American dollar. The global downward trend remains intact, but how significant is it given the price's movement over the last 18 years? In the last three years, a new upward trend has been forming, and a breakout of the global descending trend line has occurred. Thus, the path further north is open.
The positioning of the red and blue lines of the indicator continues to indicate the maintenance of a "bullish" trend. During the last reporting week, the number of longs in the "Non-commercial" group increased by 11,900, while the number of shorts decreased by 19,300. Consequently, the net position increased by another 31,200 contracts over the week.
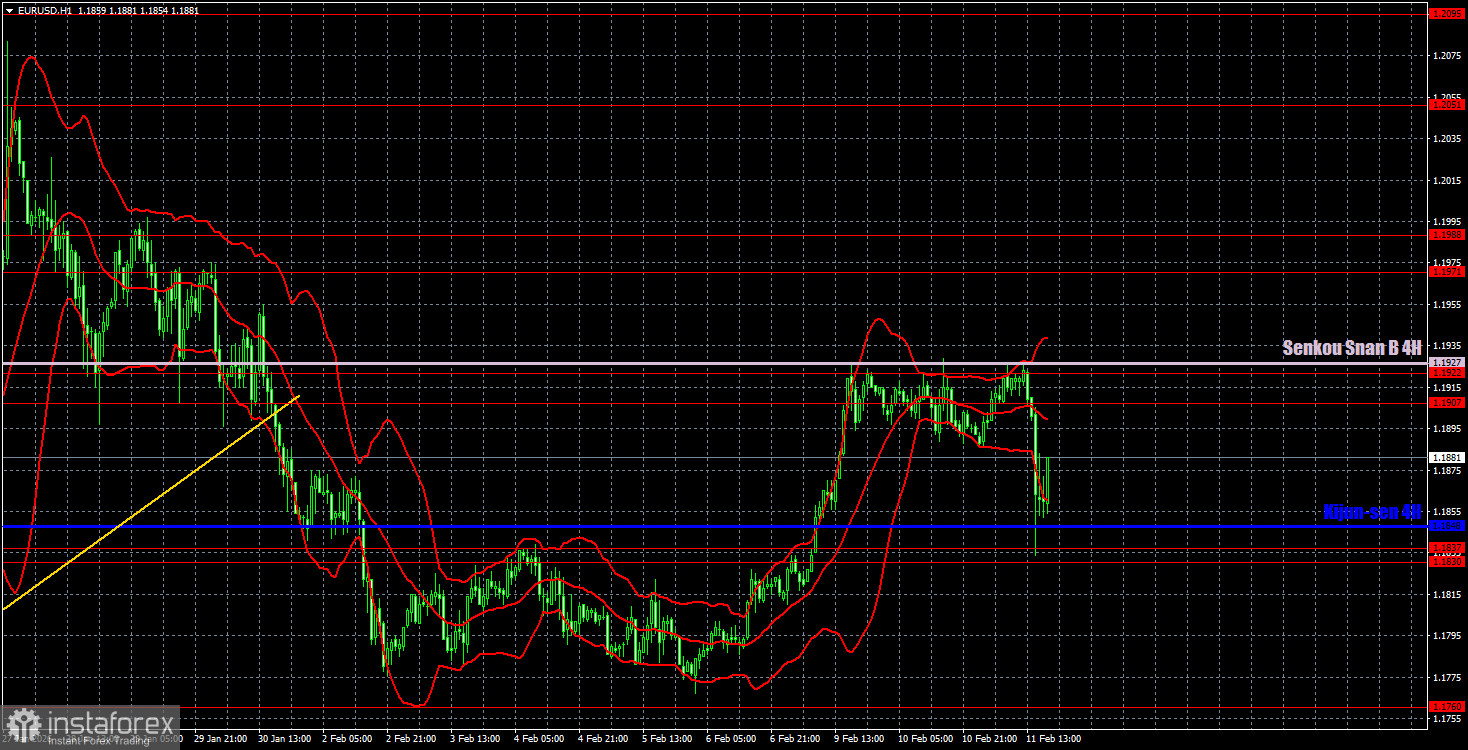
On the hourly timeframe, the EUR/USD pair remains below the Senkou Span B line, hindering its upward movement. The pair exited the sideways channel of 1.1400-1.1830 at the beginning of the year, where it spent seven months, and thus the upward trend was officially resumed. For the technical restoration of the upward trend on the hourly timeframe, price consolidation above the Senkou Span B line is now required.
For February 12, we highlight the following trading levels: 1.1362, 1.1426, 1.1542, 1.1604-1.1615, 1.1657-1.1666, 1.1750-1.1760, 1.1830-1.1837, 1.1907-1.1922, 1.1971-1.1988, 1.2051, 1.2095, as well as the Senkou Span B line (1.1927) and the Kijun-sen line (1.1848). The Ichimoku indicator lines may move throughout the day, which should be taken into account when determining trading signals. Don't forget to set a Stop Loss order to break even if the price moves in the right direction by 15 pips. This will protect against potential losses if the signal turns out to be false.
On Thursday, no significant events are scheduled in the Eurozone, while in the US, only minor reports on new home sales and unemployment claims will be released. These data are unlikely to impress the market or spur active trading.
On Thursday, traders may trade in the 1.1907-1.1922 or 1.1830-1.1837 ranges. New longs will become relevant with consolidation above 1.1907-1.1922 and the Senkou Span B line, targeting 1.1971-1.1988. Short positions can be considered upon a bounce from the area of 1.1907-1.1927 with a target of 1.1848.


