Lihat juga

 29.12.2025 04:55 AM
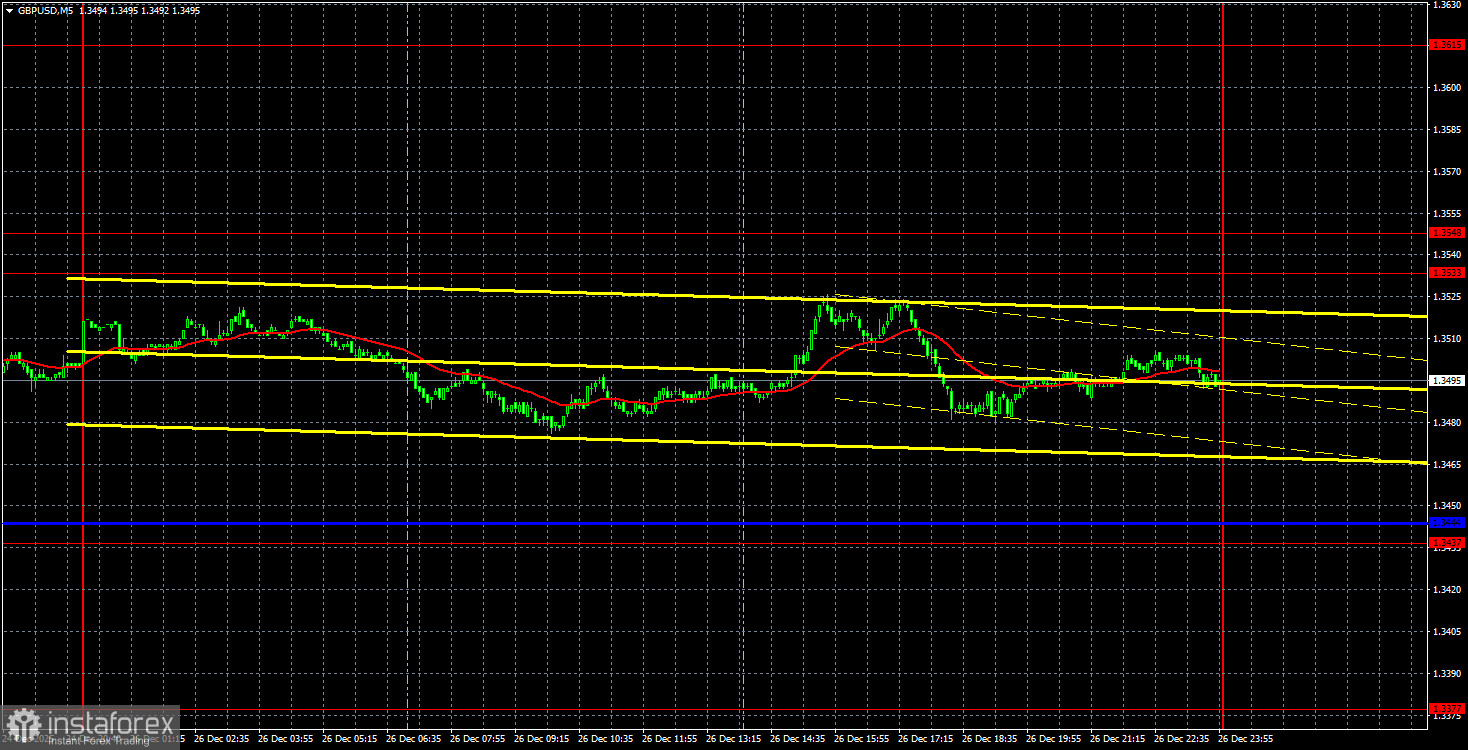
The GBP/USD pair traded with minimal volatility on Friday. This is not surprising, as Christmas and New Year celebrations are ongoing worldwide. With more holidays, traders had less motivation to open positions, and there was no macroeconomic or fundamental backdrop. Thus, trading activity will likely shift to next week. Technical analysis remained unchanged, and there were no news events to analyze.
On the hourly timeframe, a new ascending trend is still evident, with a new trend line forming. Discussing the pound's prospects for this week seems unnecessary. The economic calendar is empty, and the pair's medium-term outlook is clear. Of course, this does not mean that downward corrections are impossible or that the British currency will appreciate throughout January. However, we have analyzed the overall fundamental picture numerous times. Therefore, we expect only declines from the U.S. dollar in 2026.
On the 5-minute timeframe, no trading signals were formed on Friday. The price was unable to hold either the critical line or the 1.3533-1.3548 range throughout the day. Overall volatility for the day was 50 pips.
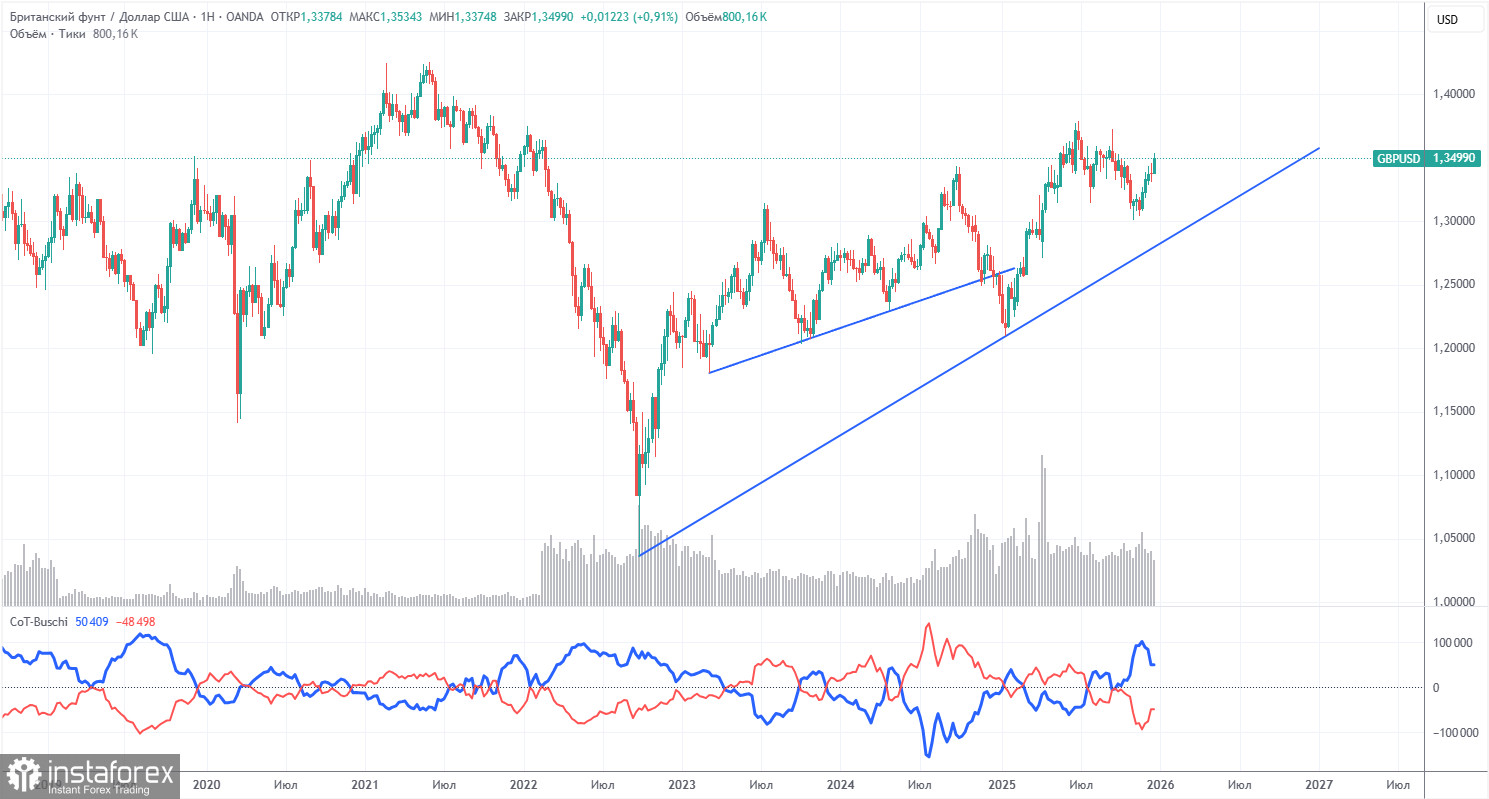
COT reports for the British pound indicate that commercial traders' sentiment has been changing consistently in recent years. The red and blue lines, which represent the net positions of commercial and non-commercial traders, frequently intersect and, in most cases, remain close to the zero mark. Currently, the lines are moving apart, but non-commercial traders dominate with short positions. Speculators are increasingly selling the pound, but, as we have mentioned, it does not matter how low the demand for the British currency is. The demand for the U.S. dollar is often even lower.
The dollar continues to decline due to Donald Trump's policies, as seen on the weekly timeframe (illustration above). The trade war will continue in one form or another for a long time. The Federal Reserve will, in any case, lower the rate in the next 12 months. Demand for the dollar will decrease one way or another. According to the latest COT report (dated December 16) for the British pound, the "Non-commercial" group opened 1,600 buy contracts and closed 25,400 sell contracts. Thus, the net position of non-commercial traders increased by 27,000 contracts over the week.
In 2025, the pound rose significantly, but it should be understood that there is only one reason: Trump's policies. Once this reason is neutralized, the dollar may start to appreciate, but when that will happen is anyone's guess.
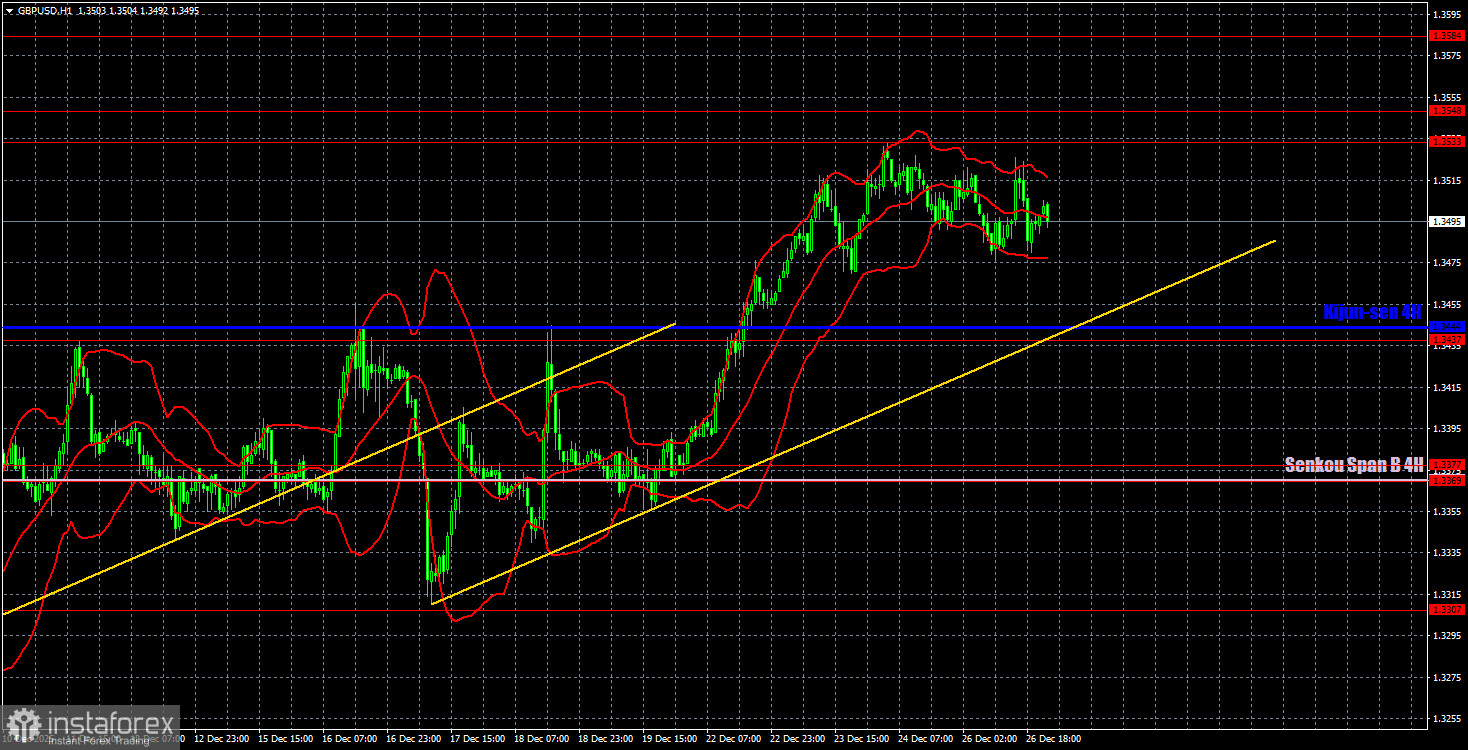
On the hourly timeframe, the GBP/USD pair continues to form a new upward trend, but the market is currently on a holiday pause. We believe that the British pound's growth in the medium-term perspective will continue regardless of the local macroeconomic and fundamental backdrop. The trend for the pound remains upward across almost all timeframes.
For December 29, we highlight the following important levels: 1.2863, 1.2981-1.2987, 1.3042-1.3050, 1.3096-1.3115, 1.3201-1.3212, 1.3307, 1.3369-1.3377, 1.3437, 1.3533-1.3548, and 1.3584. The Senkou Span B line (1.3369) and Kijun-sen (1.3444) may also serve as sources of signals. It is recommended to set the Stop Loss to breakeven upon a price movement of 20 pips in the correct direction. The lines of the Ichimoku indicator may shift during the day, which should be taken into account when determining trading signals.
On Monday, no significant events or reports are scheduled in the UK or the U.S. The upward movement may continue, but new buy signals are needed; however, flat movement and low volatility are more likely.
Today, traders may consider selling if the price bounces from the 1.3533-1.3548 area, targeting 1.3444. Long positions will become relevant upon the price stabilizing above the area of 1.3533-1.3548, targeting 1.3615, or upon a bounce from the critical line.


