Прямоугольник
сформирован 07.05 в 16:08:47 (UTC+0)
сила сигнала 2 из 5

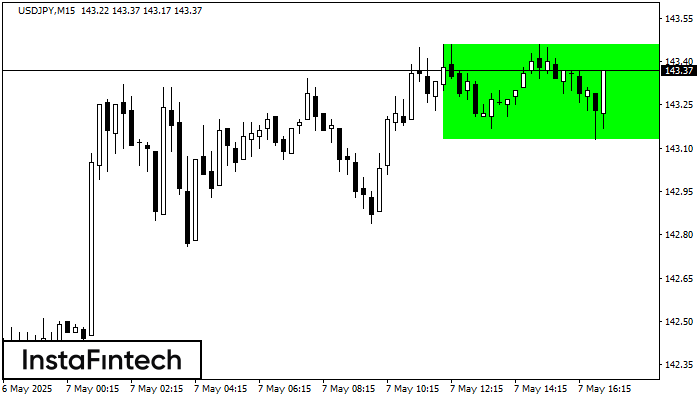
По USDJPY на M15 сформировалась фигура «Прямоугольник». Фигура данного типа относится к тому типу продолжения тренда, который содержит в себе два уровня: Сопротивление 143.46; Поддержка 143.13. В случае пробоя уровня сопротивления 143.46 возможно дальнейшее восходящее движение.
Таймфреймы М5 и М15 могут иметь больше ложных точек входа.
Сондай-ақ қараңыз
- Все
- Все
- Bearish Rectangle
- Bearish Symmetrical Triangle
- Bullish Rectangle
- Double Top
- Double Top
- Triple Bottom
- Triple Bottom
- Triple Top
- Triple Top
- Все
- Все
- Покупка
- Продажа
- Все
- 1
- 2
- 3
- 4
- 5
Bearish Rectangle
was formed on 15.07 at 18:21:50 (UTC+0)
signal strength 1 of 5
According to the chart of M5, #PEP formed the Bearish Rectangle which is a pattern of a trend continuation. The pattern is contained within the following borders: lower border 133.77
The M5 and M15 time frames may have more false entry points.
Open chart in a new window
Bearish Rectangle
was formed on 15.07 at 18:21:40 (UTC+0)
signal strength 1 of 5
According to the chart of M5, #PEP formed the Bearish Rectangle which is a pattern of a trend continuation. The pattern is contained within the following borders: lower border 133.77
The M5 and M15 time frames may have more false entry points.
Open chart in a new window
Double Bottom
was formed on 15.07 at 17:30:24 (UTC+0)
signal strength 1 of 5
The Double Bottom pattern has been formed on #TSLA M5; the upper boundary is 320.87; the lower boundary is 312.48. The width of the pattern is 824 points. In case
The M5 and M15 time frames may have more false entry points.
Open chart in a new window