

वास्तविक पैटर्न

पैटर्न ग्राफिकल मॉडल हैं जो चार्ट में मूल्य से बने होते हैं। तकनीकी विश्लेषण भविष्यवाणियों में से एक के अनुसार, इतिहास का मतलब मूल्य आंदोलन खुद को दोहराता है। इसका मतलब है कि मूल्य आंदोलन अक्सर एक ही परिस्थितियों में समान होते हैं जो उच्च संभावना के साथ स्थिति के आगे के विकास की भविष्यवाणी करना संभव बनाता है।
इंस्टा फॉरेक्स द्वारा प्रासंगिक पैटर्न एक उपयोग में आसान सेवा है जो आपको बाजार में नवीनतम परिवर्तनों के बारे में जागरूक होने और समय पर बाजार से संकेतों पर प्रतिक्रिया करने की अनुमति देती है। हमारी सेवा में आप हमेशा किसी भी जोड़ी और किसी भी समय सीमा पर नवीनतम और सबसे प्रासंगिक पैटर्न प्राप्त कर सकते हैं.
Double Top
was formed on 09.04 at 13:15:05 (UTC+0)
signal strength 2 of 5
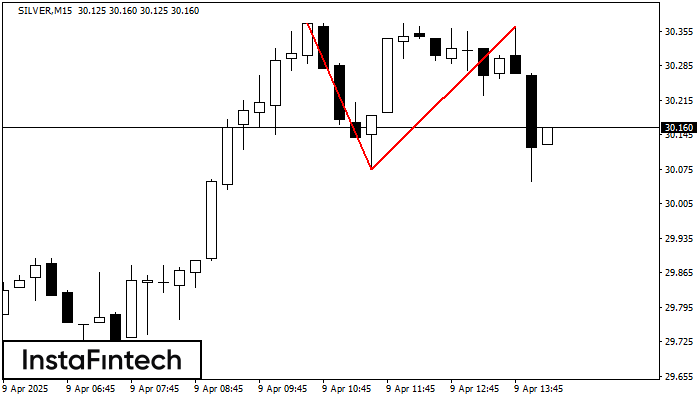
The Double Top pattern has been formed on SILVER M15. It signals that the trend has been changed from upwards to downwards. Probably, if the base of the pattern 30.07 is broken, the downward movement will continue.
The M5 and M15 time frames may have more false entry points.

