
यह भी देखें


 03.09.2026 11:09 AM
On the hourly chart, the GBP/USD pair made another unsuccessful attempt on Wednesday to consolidate below the 76.4% retracement level at 1.3489. Thus, the decline has been halted for now, while the bulls may make a couple of attempts to push the pair toward the 1.3526 and 1.3556 levels. A third attempt to consolidate below 1.3489 would allow the decline to continue toward the 1.3447 and 1.3414 levels.
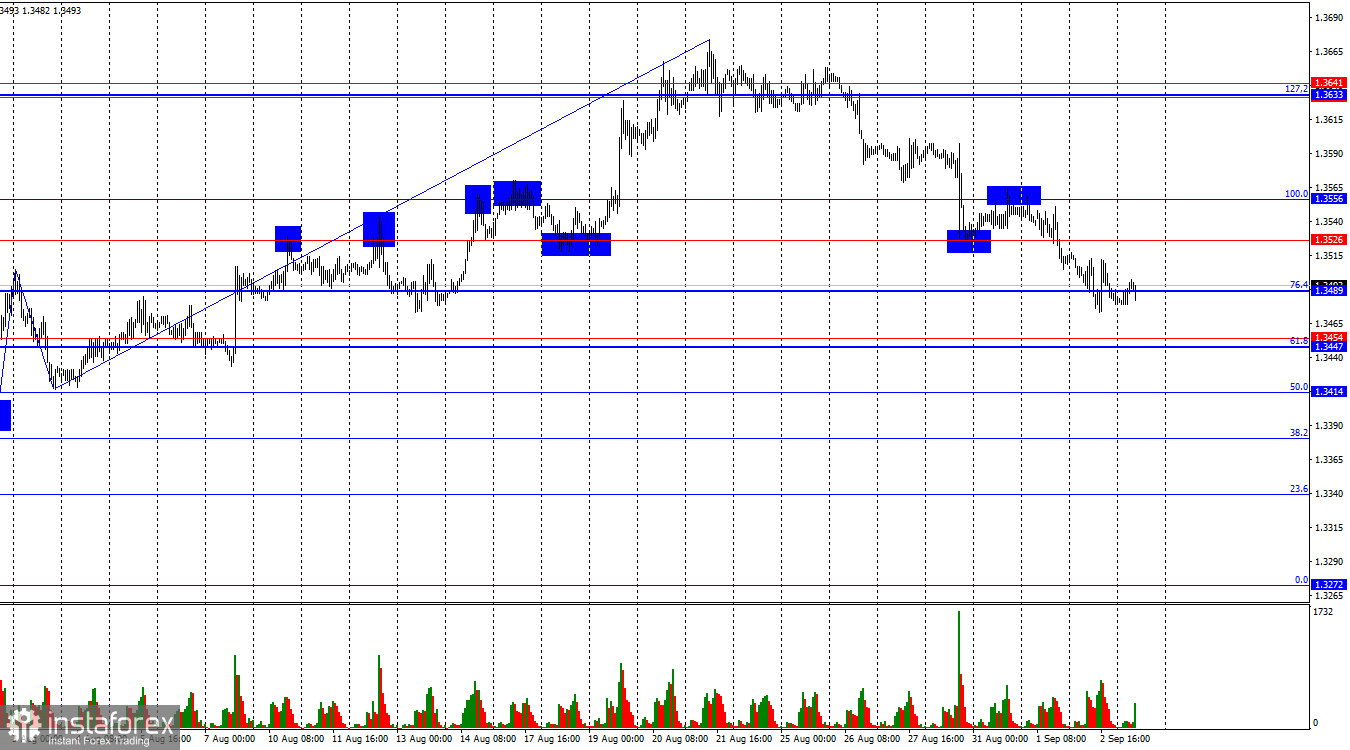
The market situation remains bullish. The latest completed upward wave broke above the previous peak, while the new downward wave has not yet broken below the previous low. Thus, the bulls currently have the initiative in the market, and their advantage remains intact. The bullish trend can be considered broken only after the low of the latest completed wave is breached, that is, below 1.3414, or after two downward waves have formed.
The fundamental backdrop on Wednesday did not allow the bears to continue their advance, which explains the unsuccessful attempt to break below 1.3489. However, the bears may make new attempts today and tomorrow. Today, the ISM services report will be important for the dollar. Tomorrow, the focus will be on Nonfarm Payrolls and the unemployment rate. The first ISM business activity index, for the manufacturing sector, was weaker than market expectations. The second, which is traditionally stronger, may come in above forecasts or, at the very least, in line with them. The same cannot be said of the US labor market reports. This week, traders have already received the ADP and JOLTS figures, and neither points to positive dynamics. The labor market cannot deteriorate indefinitely, so sooner or later we will see a strong reading. However, the point is that we may see one strong reading while the overall trend remains downward. Thus, even if tomorrow's payrolls are strong, the bears' short-term prospects will remain fairly favorable. The dollar will take advantage of every opportunity for a new advance ahead of the FOMC meeting.
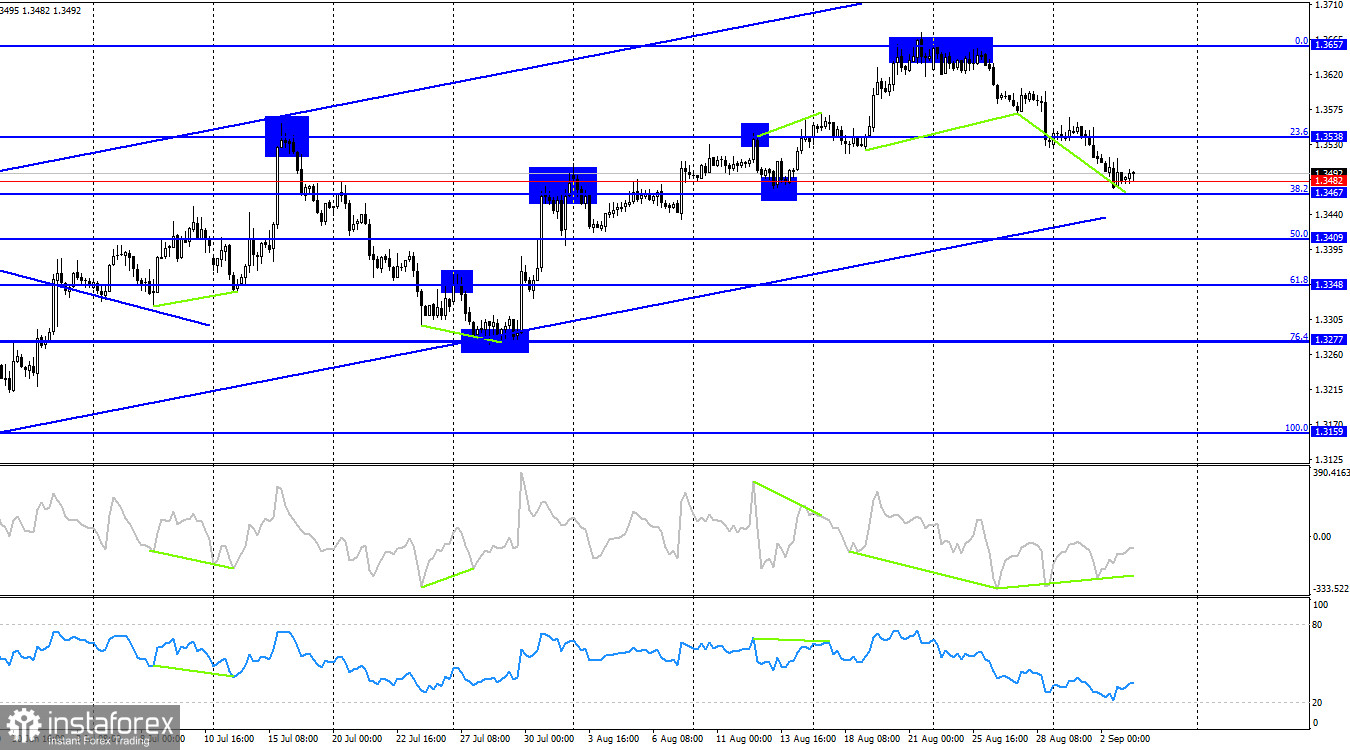
On the 4-hour chart, the GBP/USD pair declined to the 1.3467–1.3482 support level. A rebound from this zone would allow for some upside, while consolidation below the zone would signal further decline toward the 50.0% retracement level at 1.3409. A bullish divergence is forming on the CCI indicator, increasing the chances of a rebound from the 1.3467–1.3482 level.
Commitments of Traders (COT) Report:
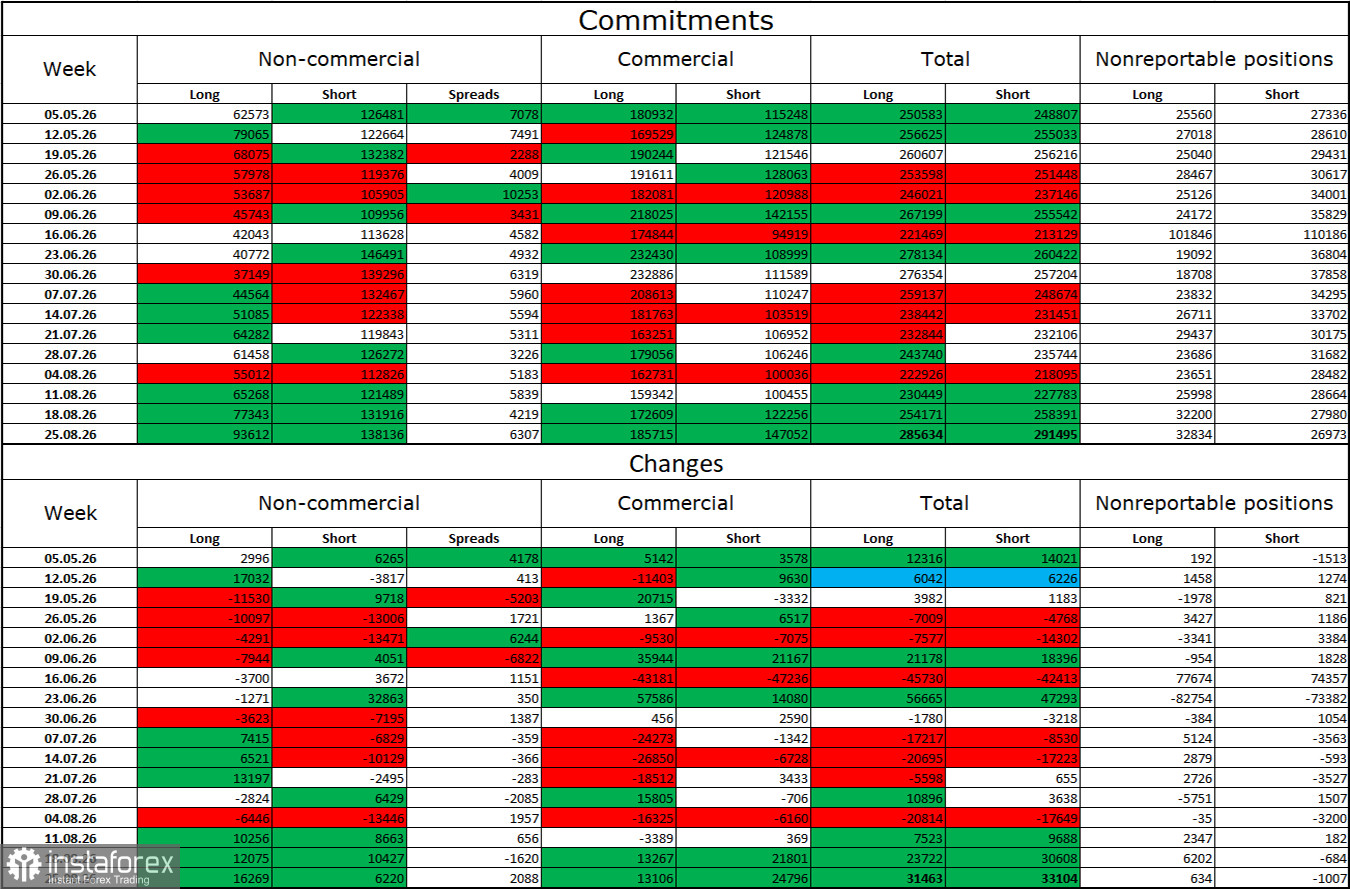
The sentiment among Non-commercial traders became less bearish over the latest reporting week. The number of Long positions held by speculators increased by 16,269, while the number of Short positions increased by 6,220. The current gap between Long and Short positions is effectively as follows: 93 thousand versus 1,382 thousand. The gap and the bears' advantage are gradually narrowing, but the bears still maintain a substantial advantage. Previously, the bears' dominance was unquestionable, but it is now being called into question because the fundamental backdrop has changed.
I still do not believe in a bearish trend for the pound, but in the near term, everything will depend on Trump's trade policy, the monetary policy of the Fed and the Bank of England, as well as the duration, scale, and consequences of the war in the Middle East. In recent months, the market had shifted toward expectations of peace, but negotiations between Iran and the United States collapsed before they had really begun. And there is no guarantee that they will resume in the near future. The Fed's monetary policy stance remains contradictory.
News Calendar for the United States and the United Kingdom:
The September 3 economic calendar contains three entries, among which the ISM index stands out. The economic backdrop may influence market sentiment on Thursday during the second half of the day.
GBP/USD Forecast and Trading Tips:
Selling the pair was possible after consolidation below the 1.3633–1.3641 level on the hourly chart and after a rebound from the 1.3556 level, with targets at 1.3489 and 1.3447. The first target was reached. Buying is possible today after a rebound from the 1.3489 level, with targets at 1.3526 and 1.3556.
The Fibonacci level grids are drawn from 1.3557–1.3272 on the hourly chart and from 1.3158–1.3655 on the 4-hour chart.

