यह भी देखें

 10.04.2026 07:29 AM
The situation in the cryptocurrency market remains unchanged. This week, it became known that Tehran and Washington reached an agreement on a two-week ceasefire, which was expected to support all risk assets and create pressure on the dollar, which has been rising exclusively on geopolitical factors over the past two months. In principle, this is exactly what happened. Bitcoin surged by $4,000, while the dollar lost about 100-150 points against its main competitors.
Now, let's look at the 4-hour time frame. What has changed? Nothing. We continue to observe a flat market. The price rose after deviating from the lower boundary of the sideways channel to the upper boundary, forming three more deviations and simultaneously removing liquidity from the recent local highs. Thus, Bitcoin may soon return to the lower boundary of the sideways channel.
Bitcoin has been trading within a flat range for two full months. During this time, Donald Trump managed to prepare the world for war in Iran, bombed Iran for five weeks with Israel, and then established a ceasefire that has already been violated. Throughout this time, Bitcoin continued to trade in the sideways channel. Therefore, we do not believe that the cryptocurrency market is reacting to geopolitical events. Of course, we observe local market reactions from time to time, but globally, nothing changes for Bitcoin.
Thus, we continue to uphold our viewpoint. On the daily time frame, a weak upward correction is still underway and could end at any time, as it has already lasted for two months. The downward trend is not over, and there are no signs of an upward trend beginning. Liquidity below the trend line has not been removed, and the $57,500 target remains unachieved.
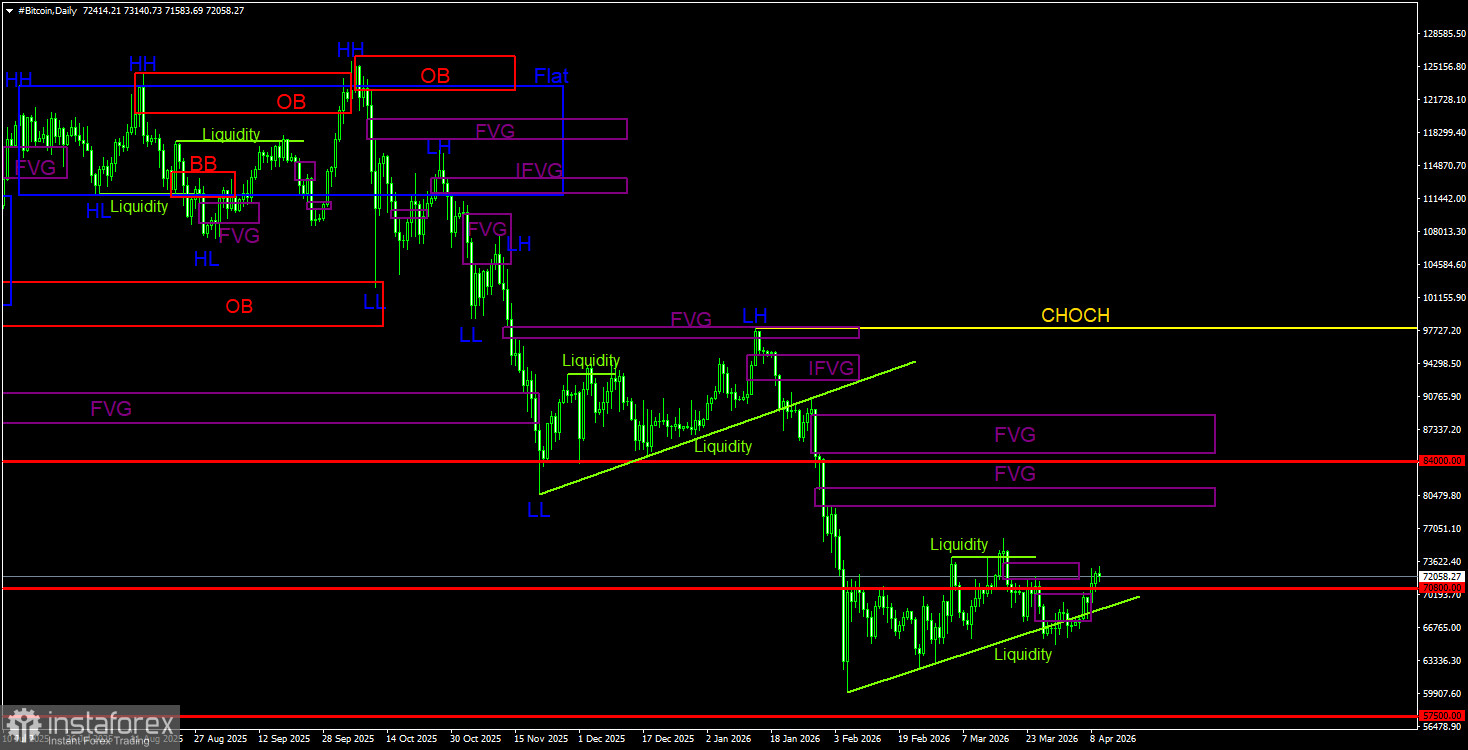
On the daily time frame, Bitcoin continues to form a downward trend. The trend structure is identified as descending, and the CHOCH line remains at $97,900. Only above this level can it be considered that the downward trend has ended. The last sell signal was formed within a "bearish" FVG ($96,900 – $98,000), providing traders with the perfect opportunity to capture almost all of the recent downward movement. Now, we can only wait. Given no signs of a trend reversal to the upside, we believe the decline will resume. On the daily time frame, the nearest POI area for new sell trades is between $79,500 and $81,100. During the current decline, two bearish FVGs have formed, with preliminary liquidity removal for sales; however, the flat on the 4-hour time frame currently plays a higher priority role.
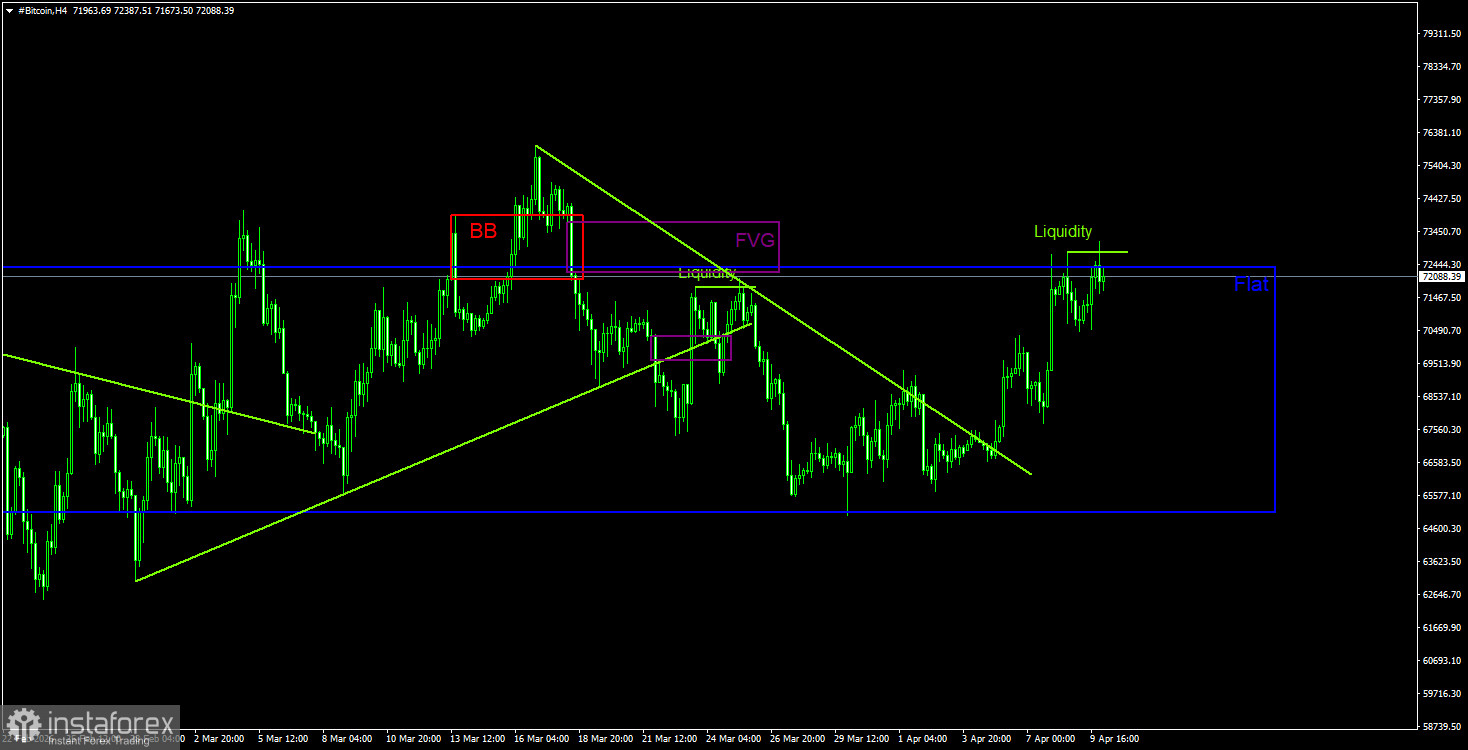
On the 4-hour time frame, the price has dropped to the lower boundary of the sideways channel, forming a deviation/rebound from it, and has risen to the upper boundary of the channel. The flat persists, so all internal patterns are of no significance. We currently trust the daily chart more, but it is this flat on the 4-hour time frame that determines the direction and strength of movement. When the flat concludes, we can shift our attention to the daily time frame. On the 4-hour time frame, Bitcoin has formed a deviation from the upper boundary, so it is reasonable to expect a decline back toward the lower boundary of the channel soon.
Bitcoin continues to form a full-fledged downward trend and a correction against it. We still expect a decline, targeting $57,500 (the 61.8% Fibonacci level from a three-year upward trend), and there are currently no signs of a trend reversal. Even the $57,500 level does not seem to be a final stop at this point. Among the POI areas, we can highlight only the nearest bearish FVG on the daily time frame, in the range of $79,300–$81,200. On the 4-hour time frame, the nature of Bitcoin's movement shows all the signs of a flat, so monitoring only deviations from the boundaries of the sideways channel remains the focus. A new deviation has just formed.

