यह भी देखें

 28.04.2026 05:32 PM
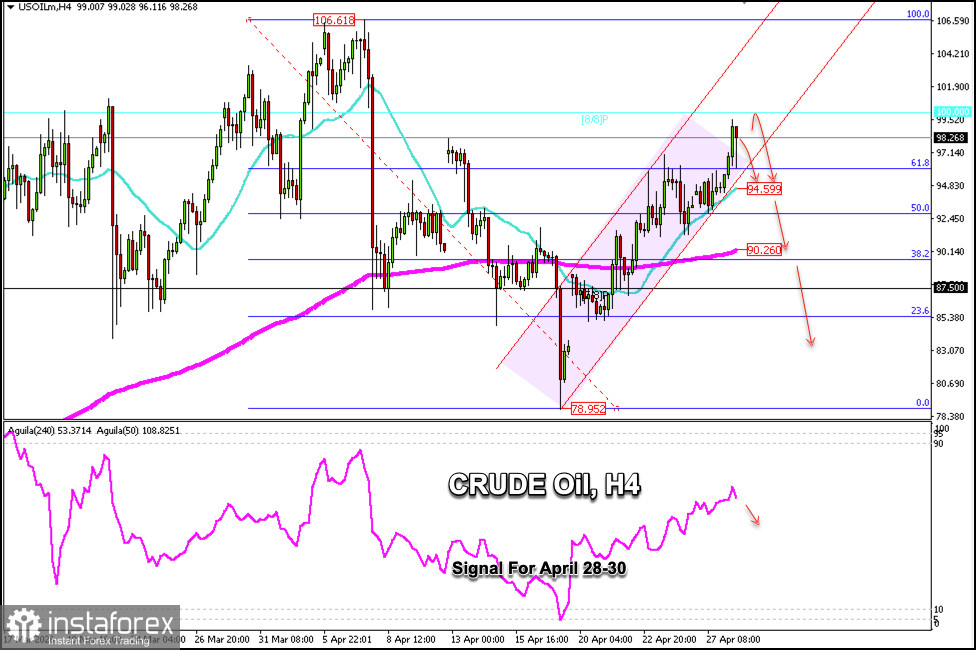
After consolidating above $93 since the start of the week around the 50% Fibonacci level, USD/OIL is gaining strong momentum, reaching the $99.48 per barrel area during the early hours of the European session.
The technical chart shows a correction below $100 toward $96.50, around the 61.8% Fibonacci level. We also see a technical rebound, but crude oil may already be struggling to continue rising, so it would be a good idea to sell.
If crude oil reaches the strong resistance at $100 around the 8/8 Murray line and encounters strong rejection in the coming hours, this could be seen as a signal to open short positions with targets at the 61.8% Fibonacci level around $96.50 and at the 21 SMA around $94.59.
On the H4 chart, we can see the Fibonacci retracement line, which crude oil surpassed at the 61.8% level during the Asian session as it approached $100. If crude oil consolidates below the 61.8% Fibonacci level, this could be seen as a clear signal to sell in the coming days.
The Eagle indicator is giving a negative signal, so we can sell around $99.50 or below this zone with targets at $96 and finally at the 21 SMA.
Crude oil left a gap on April 17, and this gap could be filled if crude oil falls below $95 and breaks decisively out of the uptrend channel; in that case, it could reach the 200-day EMA around $90 and eventually reach $83.
You have already liked this post today
*यहां पर लिखा गया बाजार विश्लेषण आपकी जागरूकता बढ़ाने के लिए किया है, लेकिन व्यापार करने के लिए निर्देश देने के लिए नहीं |

