यह भी देखें

 03.01.2024 05:05 AM
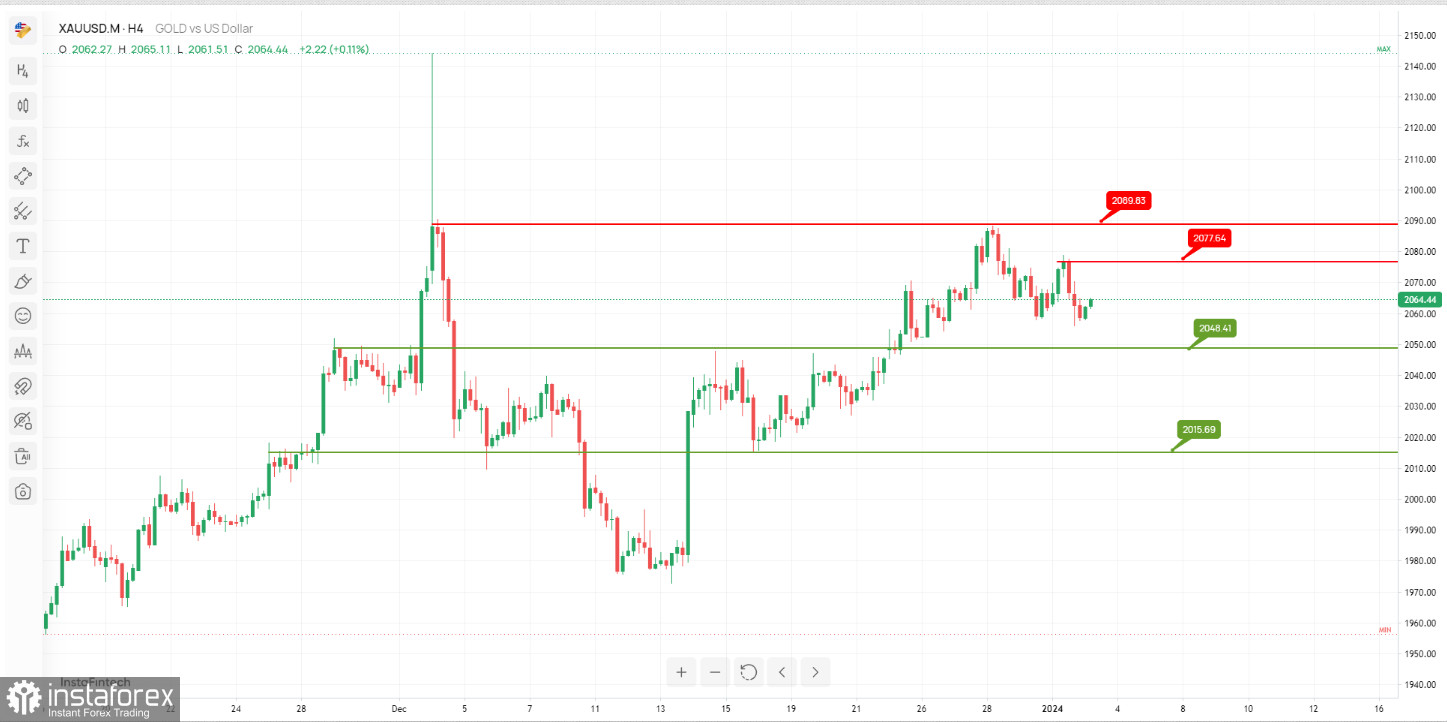
The XAU/USD chart is currently showing signs of a potential bearish reversal, with significant resistance and support levels in play.
Resistance Levels:
The 1st resistance level at 2077.64 is identified as "Swing high resistance." This level indicates a notable barrier to further upward price movement and is an essential consideration for traders. Beyond this, the 2nd resistance at 2089.83 is characterized as "Multi-swing high resistance," emphasizing its role as a significant resistance zone.
Support Levels:
On the support side, the 1st support level at 2048.41 is labeled as "An Overlap support." This level suggests a zone where buying interest may emerge, potentially facilitating a bounce or price stabilization. Further below, the 2nd support at 2015.69 is also supported by "An Overlap support," indicating the convergence of multiple factors, strengthening its position as a substantial support zone.
You have already liked this post today
*यहां पर लिखा गया बाजार विश्लेषण आपकी जागरूकता बढ़ाने के लिए किया है, लेकिन व्यापार करने के लिए निर्देश देने के लिए नहीं |

