Voir aussi

 15.01.2024 09:14 AM
Trend analysis (Fig. 1).
The GBP/USD currency pair may move upward from the level of 1.2747 (closing of Friday's daily candlestick) to 1.2790, the historical resistance level (blue dotted line). From this level, a continued upward movement is possible to the upper fractal at 1.2828 (daily candle from 28/12/2023).
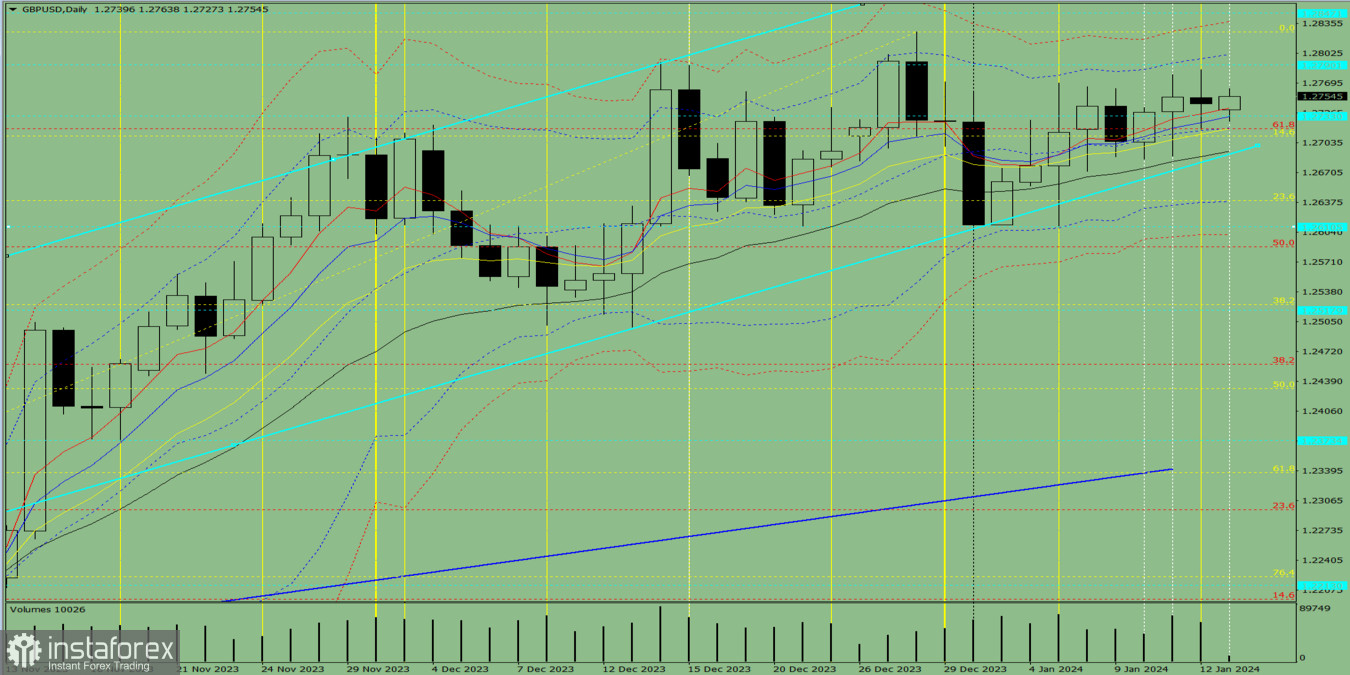
Fig. 1 (daily chart).
Comprehensive analysis:
General conclusion: Today, the price may move upward from the level of 1.2747 (closing of Friday's daily candlestick) to 1.2790, the historical resistance level (blue dotted line). From this level, a continued upward movement is possible to the upper fractal at 1.2828 (daily candle from 28/12/2023).
Alternatively, the price may move upward from level of 1.2747 (closing of Friday's daily candlestick) to 1.2790, the historical resistance level (blue dotted line). Then, the price may decline with the target at 1.2733, the historical support level (blue dotted line).
You have already liked this post today
*The market analysis posted here is meant to increase your awareness, but not to give instructions to make a trade.

