Voir aussi

 16.05.2018 06:07 AM
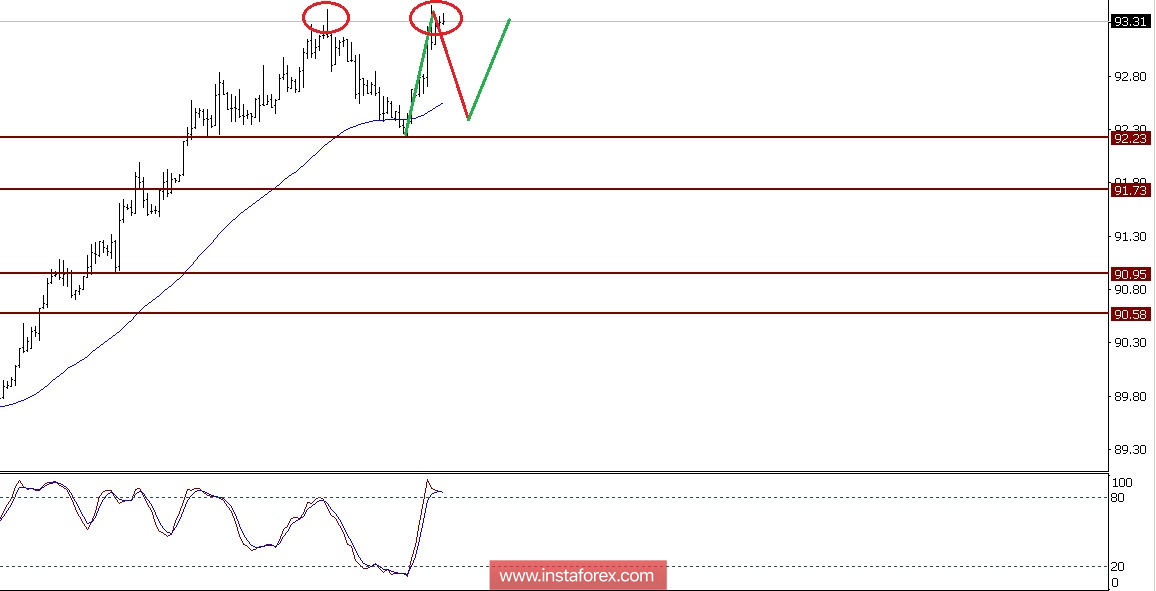
This is the USD Index after making a Double Top Formation on the 4-hour chart (see the red circle). Now it is going to test the support level at 92.23 or at near the Exponential Moving Average periode 62. As long as the price correction is not more then 91.73, there is a high probability the price will be back to the upside again at the previous resistance of 93.46.
You have already liked this post today
*The market analysis posted here is meant to increase your awareness, but not to give instructions to make a trade.

