See also

 10.06.2026 11:24 AM
The wave pattern on the 4-hour chart for EUR/USD has undergone some changes. There is still no reason to talk about the cancellation of the upward trend segment (lower chart), which began in January of last year; however, the trend structure has now taken on a corrective form. From a long-term perspective, the formation of wave C can be expected, with its low likely to be below the low of wave A. At the moment, it is difficult to believe in such a significant decline of the euro, but the first quarter of 2026 demonstrated that geopolitical developments can dramatically alter market sentiment and reverse established trends.
On the lower timeframe, I can identify a classic five-wave bearish structure. Following the completion of this structure, the instrument may transition into a new upward wave sequence, and at present the structure appears complete. Therefore, a rise in the euro can be expected from the 1.1513 level, which corresponds to the 76.4% Fibonacci retracement level. However, without support from geopolitical developments and the ECB, any appreciation of the euro is likely to face considerable difficulties.
The EUR/USD pair remained unchanged throughout Tuesday, as negative news from the Middle East once again emerged by the end of the day. It became known that Iran had shot down a U.S. Apache helicopter patrolling the Strait of Hormuz, which led to a renewed increase in risk-off sentiment. However, we will return to geopolitics shortly. After all, what else has there been to discuss over the past few months?
Several reports released in Germany and the United States yesterday deserved at least some attention from market participants. In Germany, industrial production for April increased by 0.4% month-on-month, in line with expectations. In the United States, existing home sales totaled 4.17 million units in May, slightly above market expectations, while the weekly ADP report showed an increase of 29,000 jobs. However, traders showed little interest in reacting to these reports, as their significance remains limited under current circumstances.
The euro remains on standby for a potential advance, but its position is far from ideal or even optimistic. The five-wave bearish structure appears complete, but the euro still needs support to move higher. Such support could come today from the U.S. inflation report if price growth turns out to be lower than the market expects (4.2%). Tomorrow, support could come from the ECB, which is likely to decide in favor of raising interest rates. However, it should be noted that last week the market already concluded that the ECB could become the first G7 central bank to tighten monetary policy in response to accelerating inflation. Therefore, the euro's rise could have begun as early as last week. Yet it did not. At that time, it could be assumed that the market wanted to complete the formation of the bearish wave sequence. Today, however, that sequence appears complete, while demand for the euro has yet to increase.
Based on all of the above, I believe that the market continues to be driven primarily by geopolitical developments. Yesterday, Iran shot down a U.S. helicopter, and overnight the United States launched several missile strikes against Iran. Negotiations between the parties involved in the conflict once again appear closer to failure than to success.
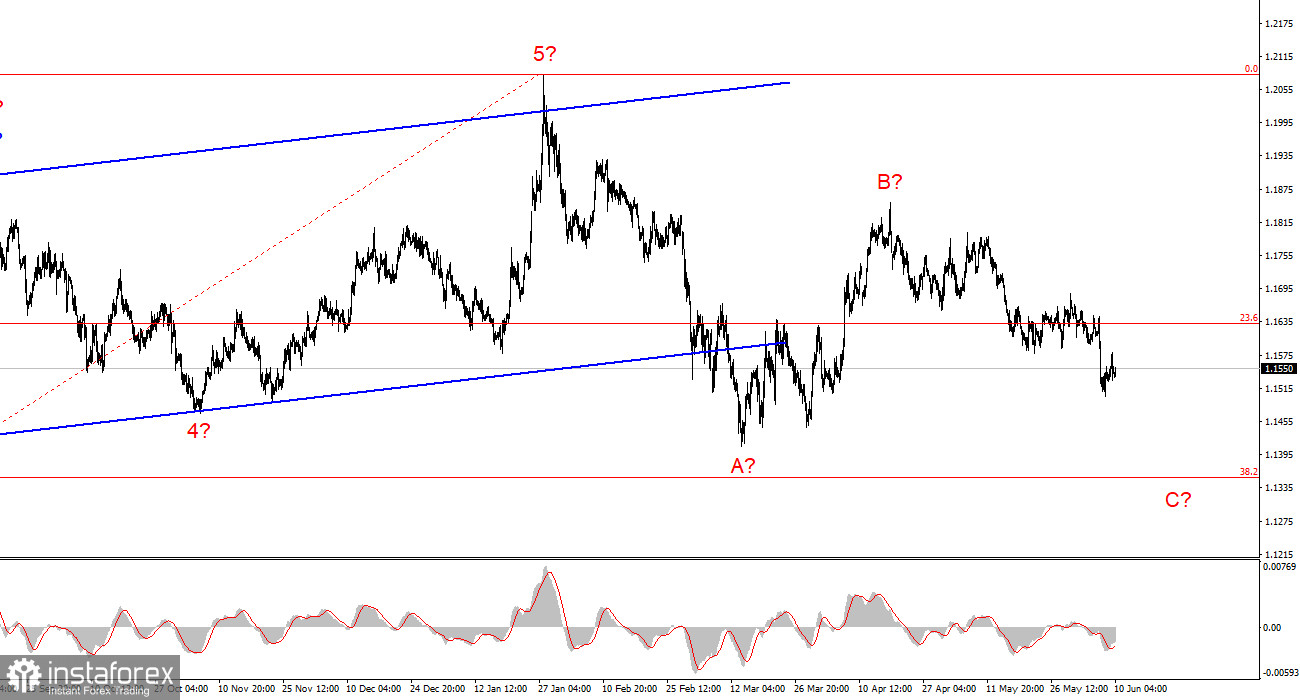
Based on my EUR/USD analysis, I conclude that the instrument remains within a broader upward trend segment (lower chart), while in the shorter term it remains within a bearish trend segment that may already be complete. In my view, the current environment offers a reasonable opportunity to consider forming long positions. An unsuccessful attempt to break below the 1.1513 level, which corresponds to the 76.4% Fibonacci retracement level, combined with the completed appearance of the bearish trend segment, suggests that the instrument may transition to a new upward wave sequence targeting the 1.1700 level and higher.
On the higher timeframe, an upward trend segment is visible, followed by the formation of a corrective wave structure. In the near future, wave C is expected to develop with targets located near 1.1352, which corresponds to the 38.2% Fibonacci retracement level. Once the A-B-C structure is completed, a new long-term bullish trend may begin.
Key Principles of My Analysis:


