See also

 07.04.2026 03:54 AM
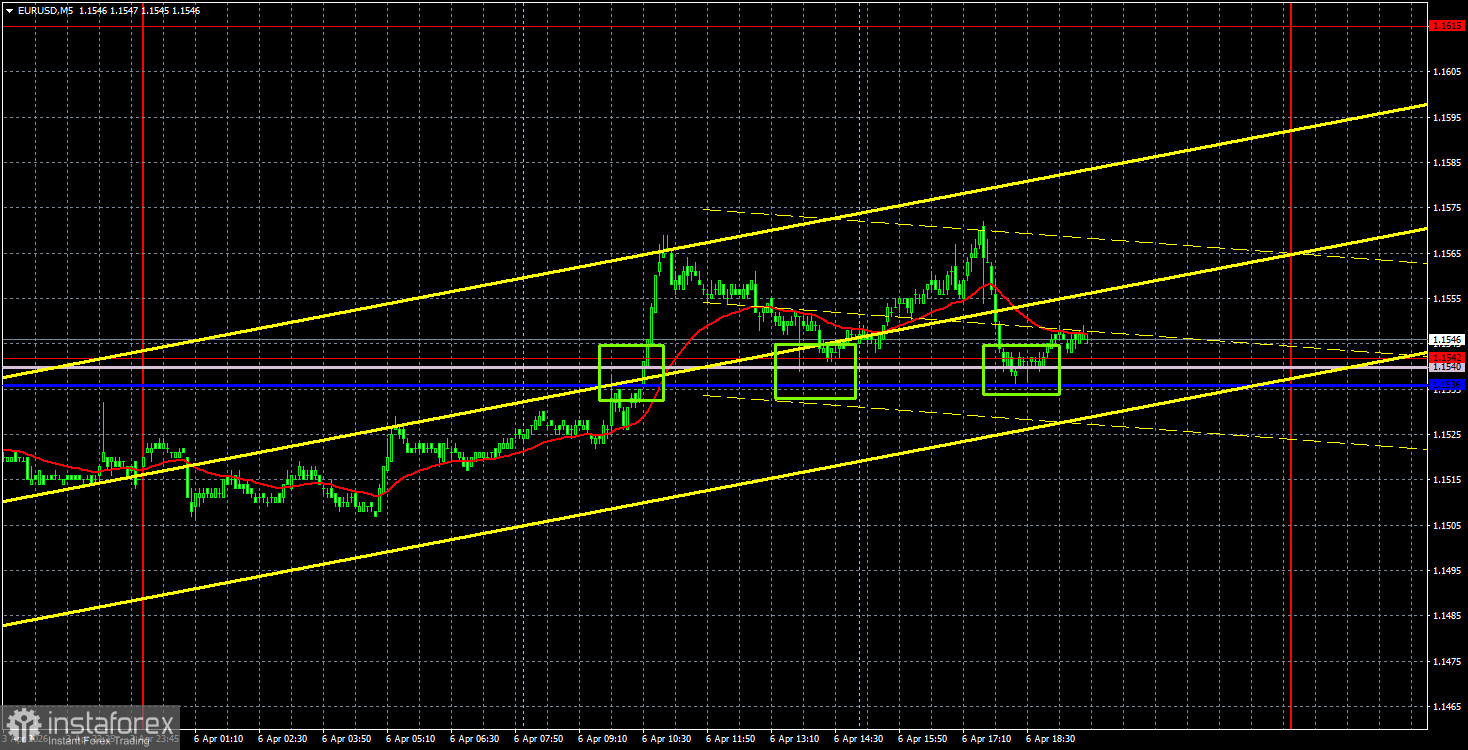
The EUR/USD currency pair traded relatively calmly on Monday, rising slightly by the end of the day. The macroeconomic background continues to have no influence on the currency pair's movement. On Friday, the market openly ignored the crucial Non-Farm Payroll and unemployment reports, and on Monday, it also disregarded the ISM Services Index. In March, the ISM index came in at 54 points, significantly below forecasts. Thus, this single report was expected to provoke a decline in the US currency. However, it caused a rise instead. More precisely, it spurred no reaction because traders paid it no attention.
Everyone is currently focused on one question: Will the US strike Iran, which, according to Donald Trump, will send the country back to the Stone Age? But what is more interesting is what the Iranian response will be. Yesterday, Iranian officials promised to completely destroy the artificial intelligence and data center Stargate in Abu Dhabi, which is the largest AI facility. Previously, Tehran stated that it would strike communication facilities in the region, water purification and desalination stations, and educational institutions. Thus, Tuesday could turn into another storm for the markets.
On Monday, within the 5-minute timeframe, three trading signals formed in the 1.1536-1.1542 range. In the first two cases, the pair moved in the desired direction by about 20 pips, but both signals turned out to be false. Therefore, traders did not incur losses from them, and the third similar signal in this area should not have been acted upon.
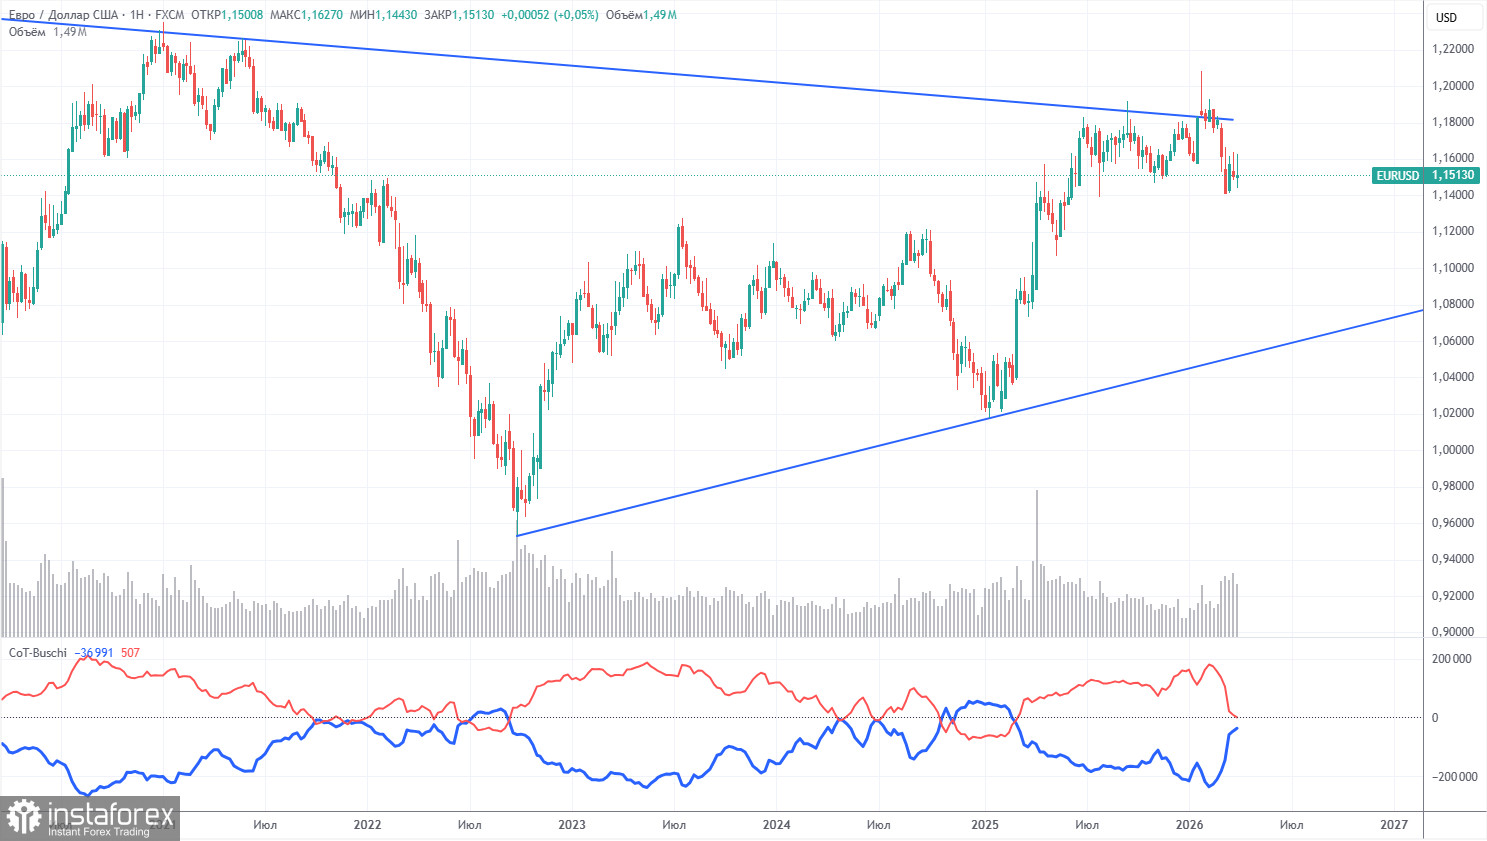
The latest COT report is dated March 31. The weekly chart clearly shows that the net position of non-commercial traders remains "bullish" but is rapidly decreasing due to geopolitical events. Traders are mass selling the European currency in favor of the US dollar. Donald Trump's policy has not changed, but the dollar is once again acting as a "reserve currency," which ensures its high demand.
We still do not see any fundamental factors that would strengthen the European currency. However, there are sufficient factors for the decline of the dollar. The war in the Middle East has made the dollar temporarily very attractive, but once this factor expires, everything may revert to the way things were. In the long term, the euro could fall to as low as 1.06 (the trend line), but the upward trend will still remain relevant.
The positioning of the red and blue lines of the indicator continues to indicate the preservation of the bullish trend. During the last reporting week, the number of longs in the "Non-commercial" group increased by 100, while the number of shorts decreased by 8,900. Consequently, the net position dropped by another 8,800 contracts over the week.
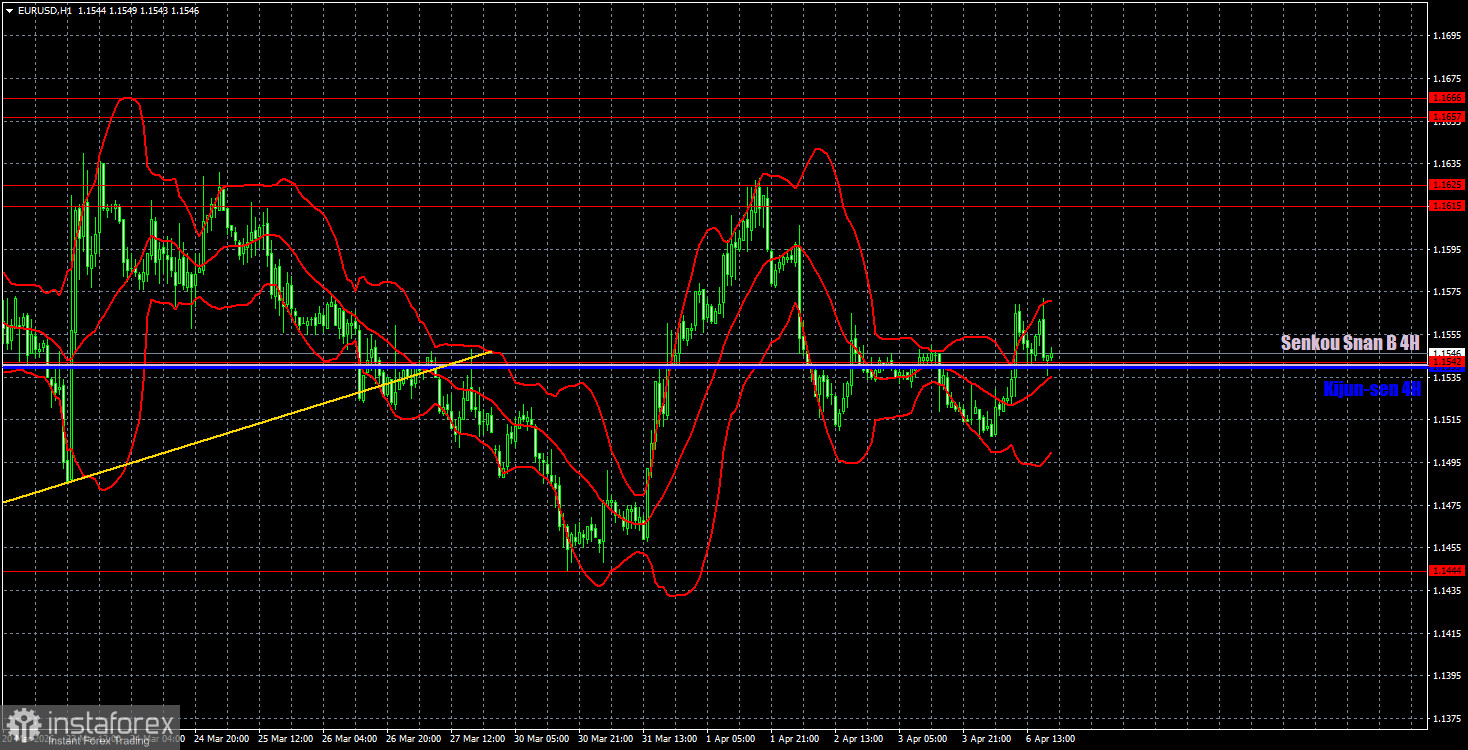
On the hourly timeframe, the EUR/USD pair is trading within a sideways channel. A new escalation in the Middle East could again shift traders' trading priorities, so any rise should be approached with caution. Trump's speeches regularly provoke market reactions, typically in opposing directions.
On April 7, we highlight the following trading levels — 1.1234, 1.1274, 1.1362, 1.1426, 1.1542, 1.1615-1.1625, 1.1657-1.1666, 1.1750-1.1760, 1.1830-1.1837, as well as the Senkou Span B line (1.1542) and Kijun-sen line (1.1540). The lines of the Ichimoku indicator may shift throughout the day, which should be taken into account when determining trading signals. Don't forget to set a stop-loss order at breakeven if the price moves in the correct direction by 15 pips. This will protect against potential losses if the signal turns out to be false.
On Tuesday, the durable goods orders report will be published in the US. In the Eurozone, the event calendar contains nothing interesting. The market may theoretically react to the American report, but significant reports did not provoke any market reaction on Friday, and the ISM index was ignored on Monday. Traders continue to focus solely on geopolitics, with expectations of a new strike against Iran and further escalation of the war in the Middle East.
On Tuesday, traders may consider short positions if the price consolidates below the Ichimoku indicator lines, targeting 1.1444. Long positions can be opened with a target of 1.1615-1.1625 if the price consolidates above the 1.1536-1.1542 range.


