See also

 03.04.2026 07:18 AM
The situation in the cryptocurrency market has not changed for a month and a half. On the daily timeframe, it remains a sluggish, weak upward correction, while on the 4-hour timeframe, it is about 80% within a range with minimal upward bias. Currently, there is no clear range, and there is no trending movement, making trading even more difficult. We observe a hybrid between a very weak upward trend and a range. After Bitcoin left the sideways channel, we considered the range canceled, as the deviation above the channel was too significant. However, the latest movements of "digital gold" show and prove that the range is still ongoing. Honestly, the latest movements resemble not even a range, but absolute randomness, similar to what we see in the currency market. The price is tossed back and forth, and traders cannot decide what to do next.
Following another brilliant and, most importantly, clear speech from Donald Trump, Bitcoin has dropped by around $2,000. For "digital gold," such a move is nothing. In the absence of other news and events, almost all experts continue to tie Bitcoin's movements to geopolitics. However, since the onset of the conflict in the Middle East, Bitcoin has shown no significant movements.
Patterns have been poorly formed. Yesterday, a signal was received within a second consecutive "bearish" FVG on the daily timeframe, but currently, we see that the decline has not yet begun. The 4-hour timeframe remains in a range, and the deviation from the lower boundary of the sideways channel may send the cryptocurrency upward again.
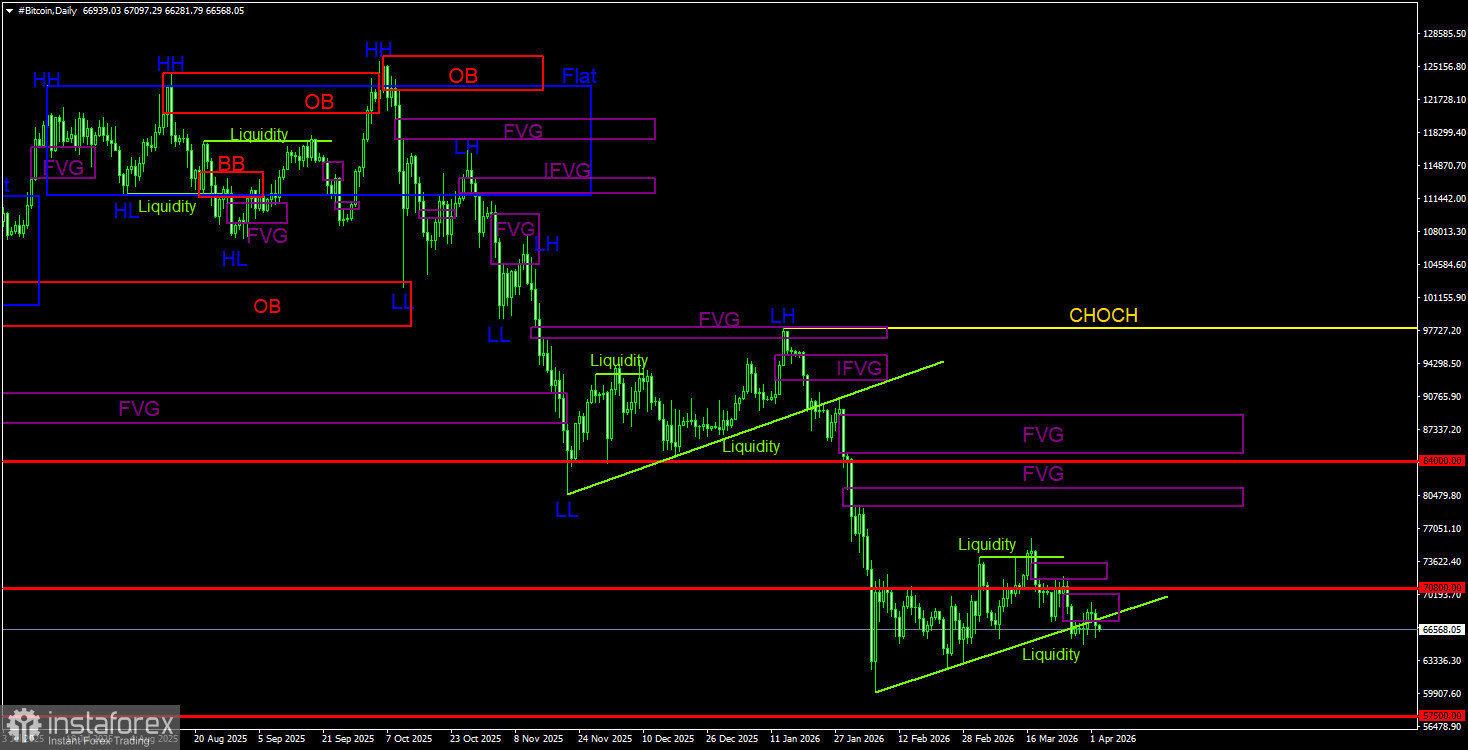
On the daily timeframe, Bitcoin continues to form a bearish trend. The trend structure is identified as downward, and the CHOCH line remains at the level of $97,900. Only above this level can it be considered that the downward trend has ended. The last sell signal was formed within the bearish FVG ($96,900 – $98,000). Thus, traders had an excellent opportunity to capture almost all recent downward movement. Now, we just have to wait. Given no signs of a trend reversal to the upside, we believe the decline will resume. On the daily timeframe, the nearest area of POI for new sell trades is in the range of $79,500 – $81,100. During the current decline, two bearish FVGs have already been formed, with initial liquidity taken for sales. A new sell signal may be formed soon.
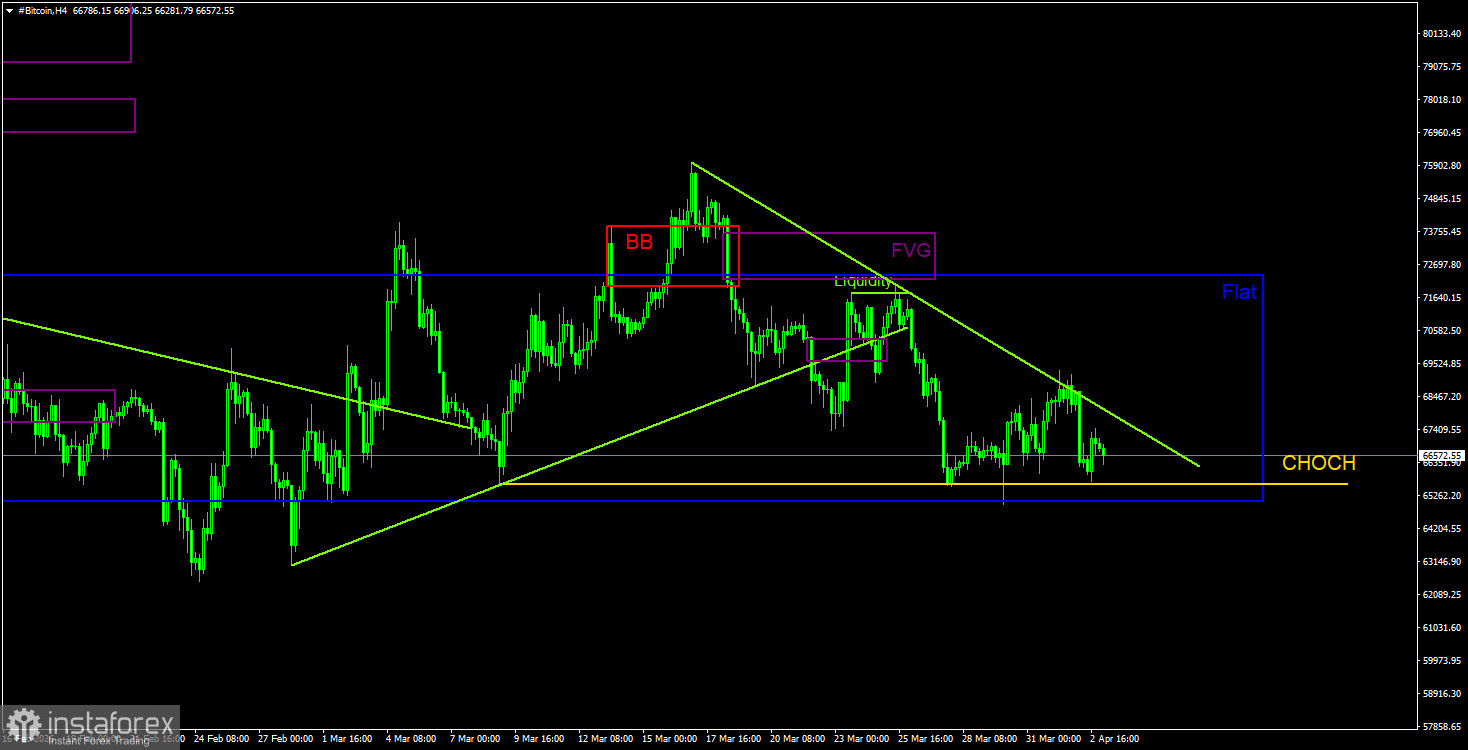
On the 4-hour timeframe, the price has dropped to the lower boundary of the sideways channel, formed a deviation/bounce from it, and may now aim for the channel's upper boundary. The descending trend line (liquidity pool) serves as an excellent target. The CHOCH line, which provides support for the upward correction, is at $65,500 and has not been breached. This means the correction continues. Breaching this line will mark the end of a month-and-a-half-long correction. If the range persists, the internal patterns hold little significance. Currently, we trust the daily chart more, but the range on the 4-hour timeframe is not completely dismissed.
Bitcoin continues to form a full-fledged downward trend and correction against it. We continue to expect a decline, targeting $57,500 (the 61.8% Fibonacci level from the three-year upward trend), and there are currently no signs of a trend reversal. However, even the $57,500 level does not appear to be a final stop. From the areas of POI, we currently note only the nearest bearish FVG on the daily timeframe, within which a signal may be formed in the coming hours. The motion of Bitcoin on the 4-hour timeframe once again exhibits all the signs of a range, so we should only monitor deviations at the boundaries of the sideways channel.


