See also

 31.03.2026 01:34 PM
Trade Review and Trading Advice for the Japanese Yen
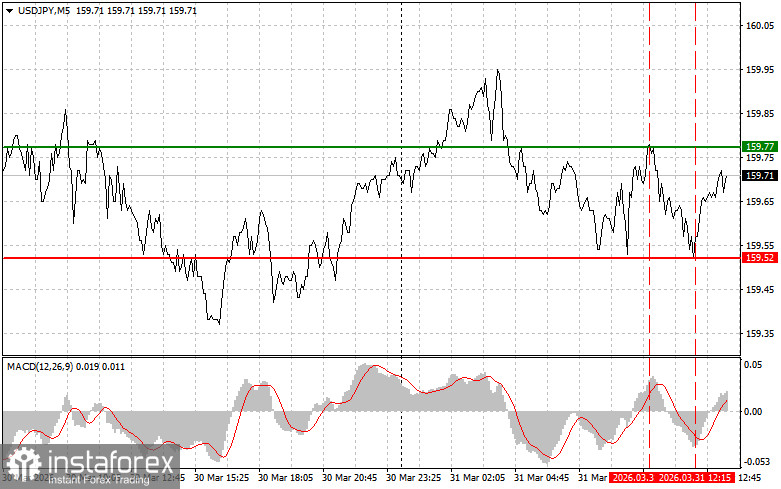
The test of the 159.77 level occurred when the MACD indicator had already moved significantly above the zero line, which limited the pair's upward potential. For this reason, I did not buy the dollar. A similar situation occurred at the 159.52 level, but in this case for selling.
Today's US trading session is expected to be active, with the release of several data points that could significantly impact the dollar's trajectory. First, market participants are focused on the US consumer confidence index. A positive trend in this indicator may signal the strength of the US economy and support bullish sentiment. Additionally, the Chicago PMI will be released later in the trading day. Strong Chicago PMI data could confirm the resilience of the manufacturing sector and strengthen the US dollar.
In addition to economic indicators, special attention will be paid to speeches by representatives of the Federal Open Market Committee. Investors will closely analyze their remarks for signals regarding future interest rate decisions, as well as their interpretation of the current inflation environment amid the Middle East energy crisis.
As for the intraday strategy, I will mainly rely on the implementation of Scenarios No. 1 and No. 2.
Buy Signal
Scenario No. 1: I plan to buy USD/JPY today upon reaching the entry point around 159.79 (green line on the chart), targeting growth to 160.10 (thicker green line on the chart). Around 160.10, I plan to exit long positions and open short positions in the opposite direction (targeting a 30–35 point move). A rise in the pair today can be expected if the Fed maintains a hawkish stance.Important! Before buying, make sure the MACD indicator is above the zero line and just beginning to rise.
Scenario No. 2: I also plan to buy USD/JPY if the price tests 159.63 twice in a row while the MACD indicator is in the oversold zone. This would limit the pair's downward potential and lead to an upward reversal. A move toward 159.79 and 160.10 can be expected.
Sell Signal
Scenario No. 1: I plan to sell USD/JPY after a break below 159.63 (red line on the chart), which could lead to a rapid decline. The key target for sellers will be 159.29, where I plan to exit short positions and open long positions in the opposite direction (targeting a 20–25 point move). Pressure on the pair may quickly ease afterward.Important! Before selling, make sure the MACD indicator is below the zero line and just beginning to decline.
Scenario No. 2: I also plan to sell USD/JPY if the price tests 159.79 twice in a row while the MACD indicator is in the overbought zone. This would limit the pair's upward potential and lead to a downward reversal. A decline toward 159.63 and 159.29 can be expected.
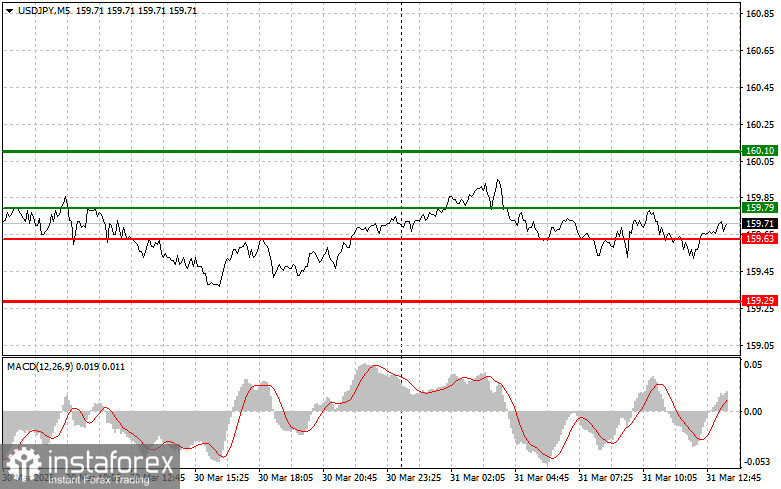
Chart Explanation
Important
Beginner Forex traders should be extremely cautious when making market entry decisions. Before major fundamental reports are released, it is best to stay out of the market to avoid sharp price fluctuations. If you choose to trade during news releases, always place stop-loss orders to minimize losses. Without stop-losses, you can quickly lose your entire deposit—especially if you do not use proper money management and trade large volumes.
And remember, successful trading requires a clear trading plan, like the one outlined above. Making spontaneous trading decisions based on current market conditions is an inherently losing strategy for an intraday trader.


