See also

 18.09.2025 11:59 AM
Trend analysis (Fig. 1).
On Thursday, from the 1.3622 level (yesterday's daily candle close), the market may continue moving downward toward the target of 1.3548 – upper fractal (red dotted line). From this level, the price may rebound upward toward 1.3583 – the 8 EMA (thin blue line).
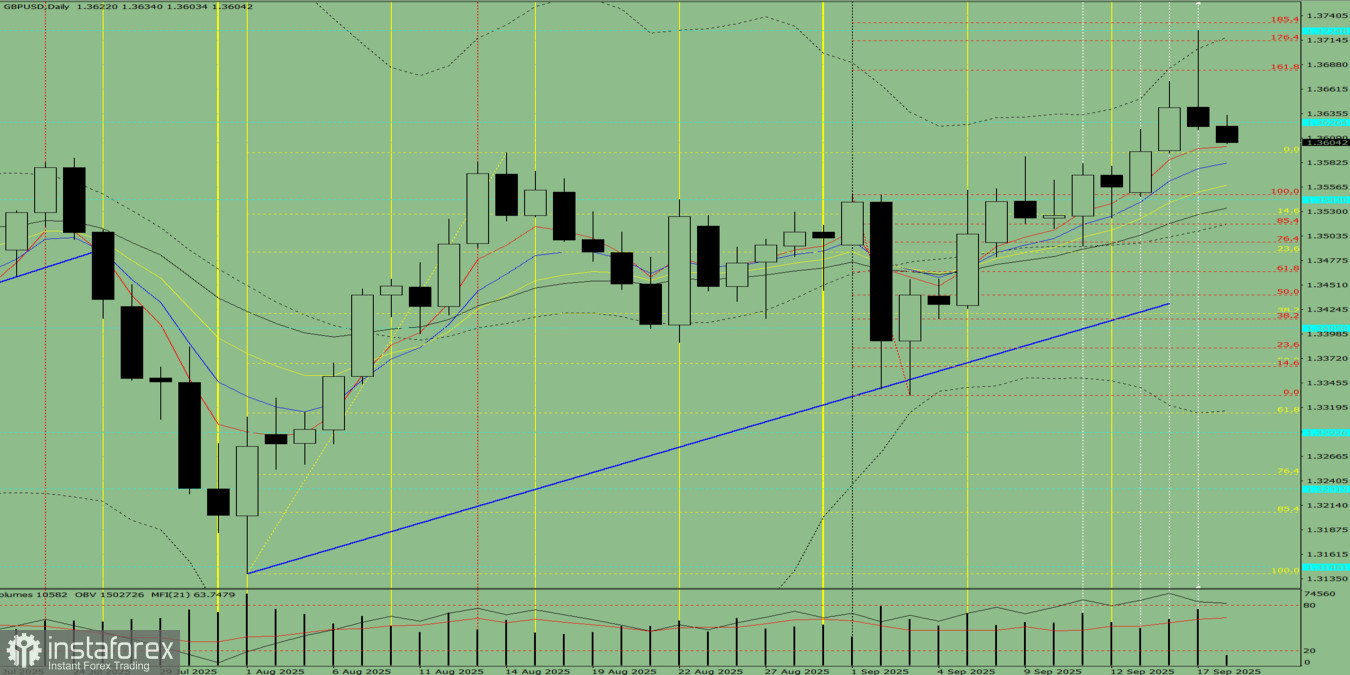
Fig. 1 (daily chart).
Comprehensive analysis:
General conclusion: bearish trend.
Alternative scenario: from the 1.3622 level (yesterday's daily candle close), the price may start moving downward toward 1.3583 – the 8 EMA (thin blue line). From this line, the price may rebound upward toward 1.3593 – upper fractal (yellow dotted line).
You have already liked this post today
*The market analysis posted here is meant to increase your awareness, but not to give instructions to make a trade.


