See also

 01.09.2025 11:15 AM
Trend Analysis.
In September, from the level of 1.3502 (close to the August monthly candle), the price may begin a downward movement targeting 1.3140 – retracement level 38.2% (red dotted line). Upon testing this level, the price may rebound upward toward 1.3270 – historical resistance level (blue dotted line).
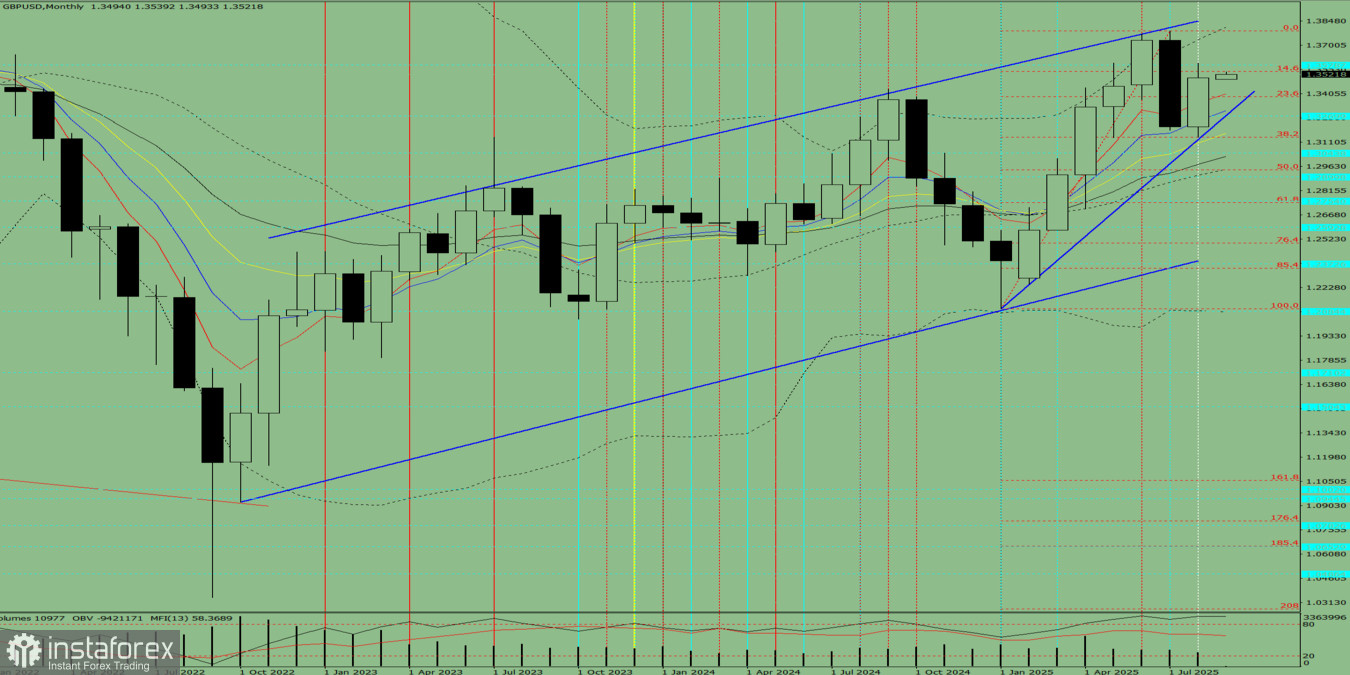
Fig. 1 (monthly chart).
Indicator Analysis:
Conclusion from comprehensive analysis: a downward trend is possible.
Overall monthly outlook for the GBP/USD candle on the monthly chart: the price will most likely show a downward trend, with no initial upper shadow on the monthly black candle (first week of the month – black) and with a lower shadow present (last week of the month – white).
Alternative scenario: from the level of 1.3502 (close of the August monthly candle), the price may begin a downward movement toward 1.2941 – retracement level 50% (red dotted line). Upon testing this level, the price may rebound upward toward 1.3044 – historical resistance level (blue dotted line).
You have already liked this post today
*The market analysis posted here is meant to increase your awareness, but not to give instructions to make a trade.


