See also

 01.09.2025 09:50 AM
Trend Analysis.
This week, from the level of 1.3502 (close of the last weekly candle), the price may continue moving downward with the target at 1.3389 – retracement level 23.6% (red dotted line). Upon testing this level, the price may extend its decline toward 1.3270 – historical support level (blue dotted line).
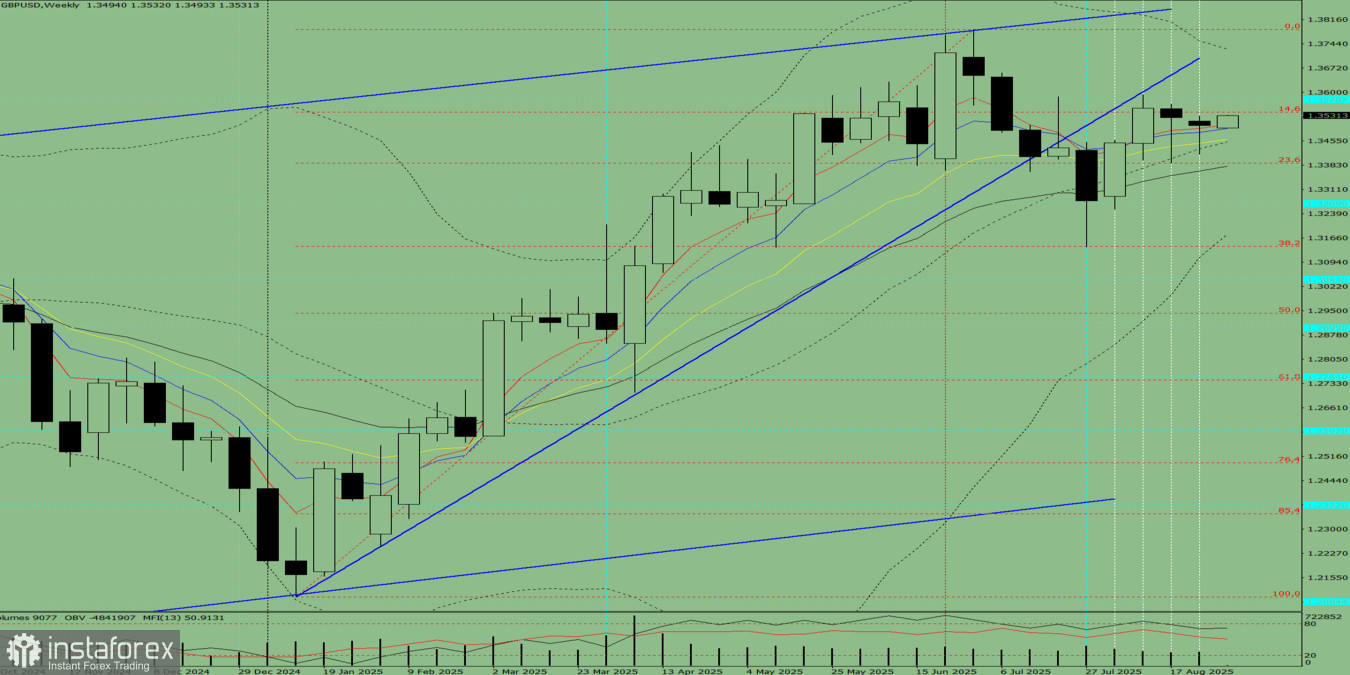
Fig. 1 (weekly chart).
Comprehensive Analysis:
Conclusion from comprehensive analysis: downward movement.
Overall weekly outlook for the GBP/USD candle on the weekly chart: the price will most likely show a downward trend during the week, with the first upper shadow on the weekly black candle (Monday – upward) and no second lower shadow (Friday – downward).
Alternative scenario: from the level of 1.3502 (close of the last weekly candle), the price may start moving downward with the target at 1.3389 – retracement level 23.6% (red dotted line). Upon reaching this level, the price may then turn upward with the target at 1.3460 – 13-period EMA (yellow thin line).
You have already liked this post today
*The market analysis posted here is meant to increase your awareness, but not to give instructions to make a trade.


